
Land and Buildings Transaction Tax (LBTT) came into effect on 1 April 2015. It is a replacement for the UK Stamp Duty and Land Tax (SDLT) which ceased to apply in Scotland on the same date. LBTT is administered by Revenue Scotland.
LBTT is a charge on land transactions in Scotland. Land transactions must be notified to Revenue Scotland unless the chargeable consideration is less than £40,000 or the transaction is otherwise exempt (such as acquisitions by the Crown or transactions in connection with a court order relating to divorce or dissolution of civil partnership). A full list of exempt transactions can be found in the LBTT guidance.
For more information about LBTT, please see the relevant sections on our website.
https://www.revenue.scot/land-buildings-transaction-tax
The Additional Dwelling Supplement (ADS) was introduced on 1 April 2016. ADS is an additional charge which is applicable when the taxpayer is not replacing their main residence. The most common scenario in which taxpayers are likely to pay ADS is where they are purchasing an additional property – for example, a buy-to-let dwelling or a second home (or holiday home) – in addition to their main residence.
In cases where, for example, a taxpayer buys a new main residence before selling their previous main residence, the taxpayer initially pays ADS but then has 18 months4 from the effective date of the original transaction to sell their previous main residence and reclaim the ADS.
For more information about ADS, please see the relevant sections on our website.
Throughout this publication ‘gross ADS’ refers to the ADS declared due and ‘net ADS’ refers to the ADS declared due minus any repayments of ADS claimed.
The current rates for LBTT (and ADS) are set by the Scottish Government and approved by the Scottish Parliament.
In May 2020, the Scottish Parliament approved a temporary change to LBTT rates, having the effect of raising the nil rate tax threshold from £145,000 to £250,000 for all residential conveyance transactions, effective from 15 July 2020 to 31 March 2021.
https://www.revenue.scot/land-buildings-transaction-tax/guidance/calculating-tax-rates-and-bands
The LBTT legislation requires three-yearly reviews of lease transactions in order to assess any changes in the LBTT due through, for example, rent reviews and extensions. The first three-yearly reviews of lease transactions were received from 1 April 2018. Unless the lease has been terminated or assigned, a further LBTT return must be submitted by the tenant at every third anniversary of the effective date of the lease (i.e. year 3, year 6, year 9 etc.) and any additional LBTT paid or overpaid LBTT reclaimed.
For more information on three-yearly reviews of lease transactions please see the relevant sections on our website.
Where a lease has been notified to Revenue Scotland and is later assigned to a new tenant, the assignor (the outgoing tenant) must make a further LBTT return to Revenue Scotland within 30 days of the day after the lease was assigned. Where a lease has been notified to Revenue Scotland and is later terminated for any reason (including a renunciation of the lease), the tenant at the point of termination must make a further LBTT return to Revenue Scotland within 30 days of the day after the lease is terminated. Assignations and terminations were received prior to 1 April 2018 but they were not distinguished in the statistics from lease transactions prior to this date.
For more information on assignations and terminations, please see the relevant sections on our website.
Throughout this publication ‘reviews of a lease’ refers to three-yearly reviews, assignations and terminations. LBTT from reviews of a lease is the additional LBTT declared due minus any repayments claimed. This net figure may be positive or negative.
2.1 Overview
Figure 1: LBTT declared due by transaction and year

Every year so far, residential conveyances have accounted for more LBTT than each of the other transaction types: non-residential conveyances, leases and reviews of a lease. Prior to the introduction of the Additional Dwelling Supplement (ADS) on 1 April 2016, residential and non-residential conveyances accounted for similar amounts of LBTT. ADS almost exclusively affects residential transactions, although a small number of non-residential conveyances with a residential component pay ADS. Since the introduction of ADS, residential conveyances have accounted for approximately twice to three times the revenue of non-residential conveyances. This reflects the introduction of ADS, and an increase in LBTT excluding ADS from residential conveyances (e.g. due to house price increases), while LBTT revenue from non-residential conveyances has remained relatively flat. Leases account for much less LBTT than residential and non-residential conveyances.
Since 2016/17, residential conveyances have accounted for 66 per cent of LBTT, non-residential conveyances have accounted for 30 per cent of LBTT and leases have accounted for 4 per cent of LBTT. Reviews of a lease have accounted for less than 0.1 per cent of LBTT since taking effect in 2018.
In total, LBTT (as at 31 May 2021) has increased from £416 million for tax returns originally received in 2015/16 to £601 million in 2019/20, decreasing to £526 million in 2020/21.
During 2020/21, both the number of LBTT returns received and the value of tax declared were significantly disrupted by impacts of the COVID-19 pandemic. From April to June 2020, residential property transactions were limited by restrictions on viewings and restrictions on house moves; both residential and non-residential conveyances were affected by restrictions on registering a title; and all types of conveyance and lease transactions were potentially affected by general economic uncertainty at the start of the pandemic. From April to June 2020, 62% fewer LBTT returns were received than the same period of 2019.
House move restrictions were lifted on 29 June and, in addition, the Scottish Parliament approved a temporary change to rates of LBTT on residential transactions, effective from 15 July 2020 to 31 March 2021, raising the taxable threshold (nil rate band) to £250,000. The number of LBTT returns recovered substantially from August 2020 to March 2021, and by the end of the year the number of LBTT returns received during 2020/21 was only 10 per cent lower than that for 2019/20. The overall 17 per cent decrease in total LBTT declared due (excluding ADS) from 2019/20 to 2020/21 reflects the fact that fewer transactions took place during the year, and that less tax was due for the majority of residential transactions during the year due to the temporary change to the tax bands, offset to some extent by a clear increase in average house prices from around September 2020 onwards5 . The recovery in non-residential LBTT revenues (including leases) was not as marked as that for residential revenues, with an overall drop of 26% in non-residential LBTT revenue from 2019/20 to 2020/21.
The relationship between revenue figures in this publication and those published in Revenue Scotland’s Annual Report and Financial Statements is described in Appendix B.
Table 1: Number of LBTT returns received by type of transaction and year
| Number of LBTT returns received | ||||||
|---|---|---|---|---|---|---|
| Type of transaction | 2015/16 | 2016/17 | 2017/18 | 2018/19 | 2019/20 | 2020/21 |
| Residential conveyance | 103,680 | 100,500 | 103,930 | 103,750 | 105,110 | 96,900 |
| Non-residential conveyance | 6,220 | 6,810 | 6,880 | 7,160 | 6,440 | 5,940 |
| Lease | 5,260 | 5,690 | 5,570 | 5,130 | 4,920 | 3,500 |
| Review of a lease | 4,220 | 4,570 | 2,900 | |||
| All | 115,150 | 113,000 | 116,380 | 120,250 | 121,040 | 109,240 |
The number of LBTT returns received by type of transaction is more consistent over time than the corresponding LBTT declared due. Residential conveyances have accounted for the majority (88 per cent) of LBTT returns received since 2015. Non-residential conveyances have accounted for 6 per cent of LBTT returns received with leases accounting for around 4 per cent. Reviews of a lease have accounted for 3 per cent of returns in the three years since taking effect in 2018/19.
It is worth noting that non-residential conveyances account for a much higher proportion of LBTT declared due (30 per cent since 2016/17) than LBTT returns received (6 per cent). This is because small numbers of high-value non-residential conveyances typically account for a relatively large proportion of LBTT. By contrast, reviews of a lease account for a much higher proportion of LBTT returns received (3 per cent since April 2018) than LBTT declared due (less than 0.1 per cent).
2.2 Residential LBTT excluding ADS
In this section we summarise the trends in LBTT excluding Additional Dwelling Supplement (ADS) declared due for residential conveyances and the number of residential conveyance returns received. There are good reasons for presenting analysis of LBTT excluding ADS separately from analysis of ADS. Analysing trends in total LBTT declared due for residential conveyances is complicated by the introduction of the ADS on 1 April 2016 which introduces a break in the LBTT revenue time series. Furthermore, as the ADS may be reclaimed when the taxpayer sells their previous main residence, the series is subject to large downward revisions for many months. This is less problematic for non-residential conveyances as net ADS revenue accounts for a very small proportion of LBTT revenue from non-residential conveyances (due to the few non-residential transactions with a residential component subject to ADS) (See Figure 1).
Table 2: LBTT excluding ADS declared due and number of LBTT returns received by year for residential conveyances
| 2015/16 | 2016/17 | 2017/18 | 2018/19 | 2019/20 | 2020/21 | |
| LBTT excluding ADS (£ Millions) | 202.0 | 214.3 | 260.2 | 261.0 | 287.1 | 256.9 |
| Annual percentage change in LBTT excluding ADS | 6.1% | 21.4% | 0.3% | 10.0% | -10.5% | |
| LBTT returns received | 103,680 | 100,500 | 103,930 | 103,750 | 105,110 | 96,900 |
| Annual percentage change in LBTT returns received | -3.1% | 3.4% | -0.2% | 1.3% | -7.8% | |
| LBTT excluding ADS per return received (£)* | 1,900 | 2,100 | 2,500 | 2,500 | 2,700 | 2,700 |
* Rounded to the nearest £100
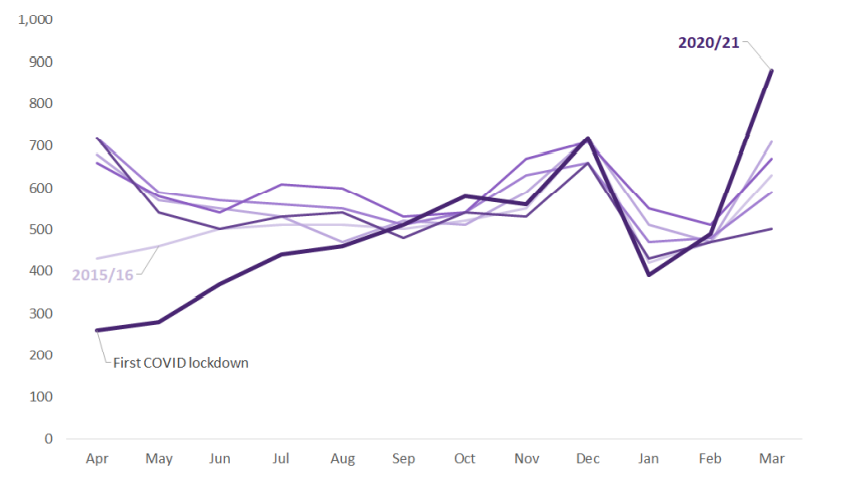
Revenue excluding ADS from residential conveyances increased each year to 2019/20, from £202 million in 2015/16 to £287 million in 2019/20, before decreasing to £257 million in 2020/21. Meanwhile the number of returns received remained relatively stable until 2019/20, before dropping slightly to 97,000 in 2020/21. This 8 per cent decrease in number of returns received from 2019/20 to 2020/21 masks a much sharper drop in the first quarter of 2020/21, followed by recovery in the later part of the year, as shown in Figure 2.
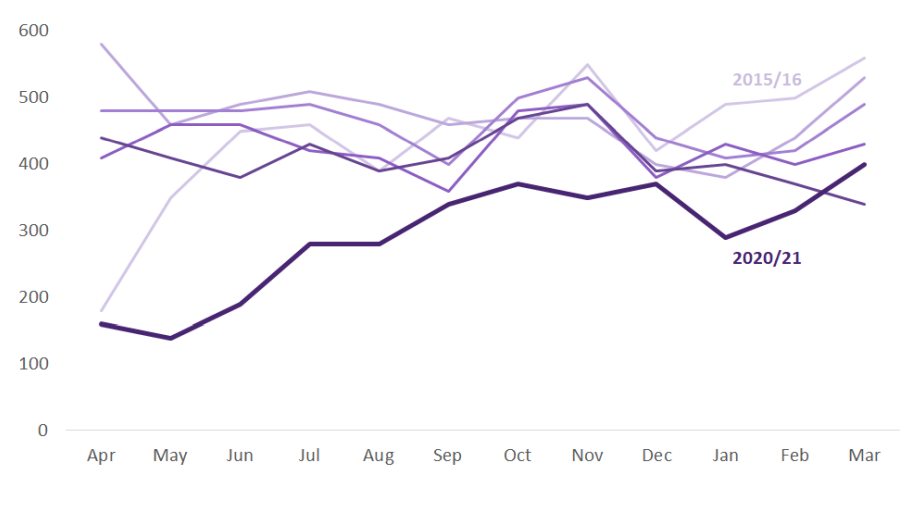
Figure 2: Number of residential conveyance returns received by month
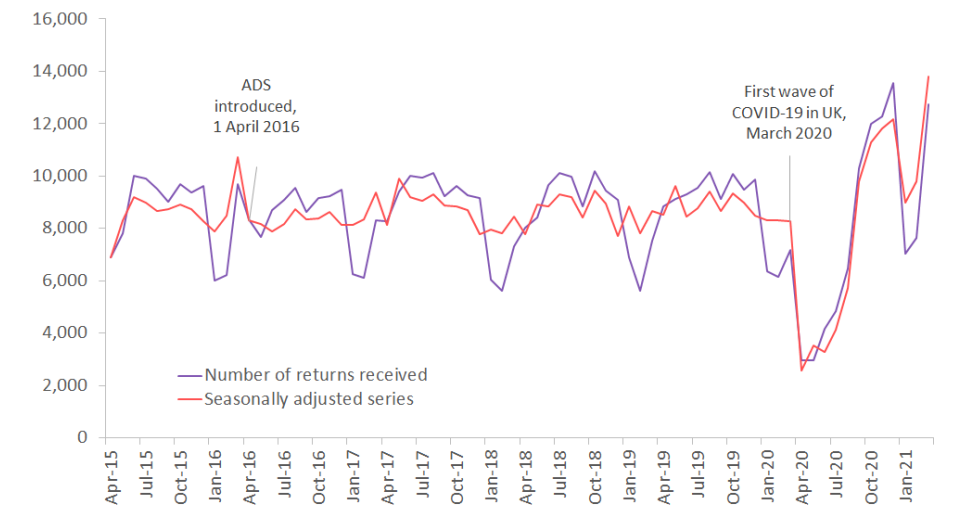
Figure 3: LBTT excluding ADS declared due for residential conveyances received by month
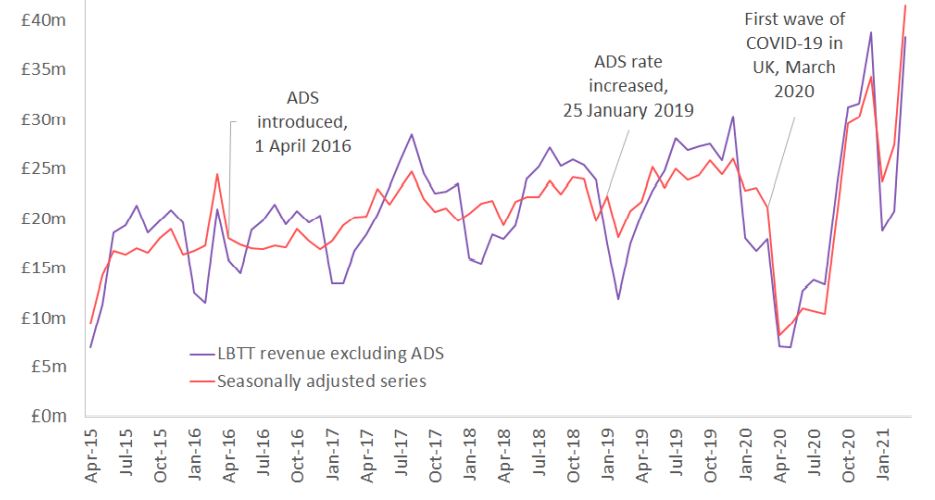
Both the number of residential LBTT returns and the revenue excluding ADS show consistent seasonal, monthly, and weekly patterns. Fewer returns are received in January and February (6,100 per month on average compared to 9,100 on average for other months), and these months are also associated with lower average house prices6 (e.g. due to a higher proportion of lower value properties sold at this time of year). More returns are received on Fridays than other weekdays (570 compared to 350 per day), and the last Friday of each month typically sees the highest residential returns (590 per day). After accounting for the known seasonal and calendar effects, the number of residential LBTT returns received remained relatively constant from 2015/16 to 2019/20, with some variation from month to month remaining unexplained by these factors. LBTT revenues excluding ADS from residential returns increased over the same period, from around £15 million per month in 2015 to around £24 million in early 2020, consistent with year on year increases in average property values.
From March 2020 onwards, the seasonal pattern of property transactions was significantly disrupted by the impact of the COVID-19 pandemic, including restrictions on house moves from late March to late June 2020, and subsequent recovery and release of "pent-up demand". After accounting for the pre-COVID-19 seasonal cycle and calendar effects, residential LBTT transactions and revenue were substantially suppressed from April to August 2020 before rapidly recovering and reaching unusually high levels in December 2020 and March 2021.
During March 2016, seasonally adjusted residential LBTT return volumes and revenue excluding ADS were higher than otherwise expected, as some buyers rushed to complete transactions before the introduction of ADS on 1 April 2016. A similar effect may have contributed to the unseasonally high numbers of returns in March 2021, ahead of the nil rate band threshold reverting back to £145,000 from its temporary level of £250,000 (from 15 July 2020 to 31 March 2021). For more information on numbers of returns and revenue after March 2021, see the most recent monthly LBTT statistics publication.
Figure 4: Distribution of residential conveyance returns received by residential LBTT band and year
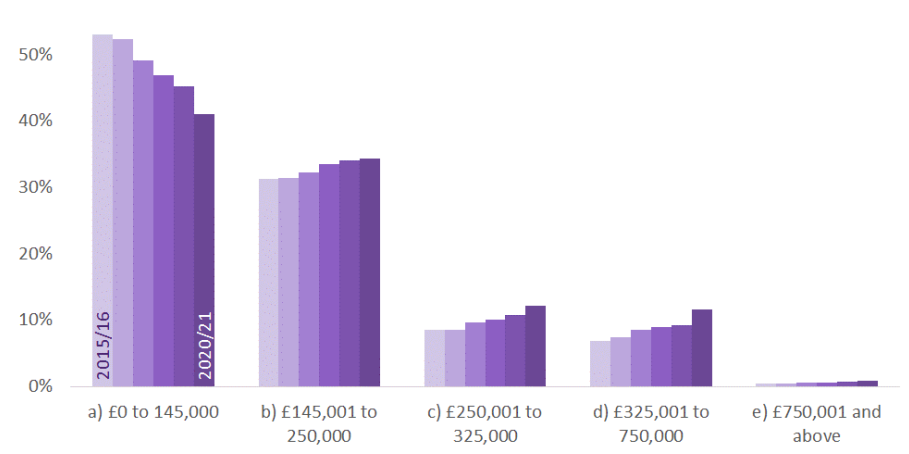
Figure 5: Distribution of LBTT excluding ADS by residential LBTT band and year for residential conveyances
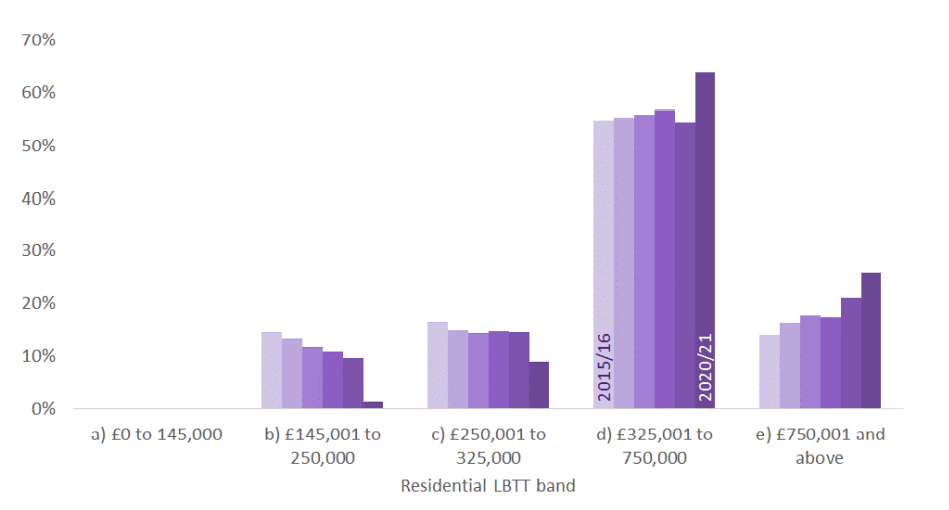
41 per cent of returns received in 2020/21 had total consideration less than or equal to £145,000 and, therefore, had zero tax liabilities7 regardless of the temporary nil rate band threshold increase. LBTT revenue is dominated by the £325,000 to £750,000 band, which in 2020/21 contributed 64 per cent of LBTT while making up only 12 per cent of returns. The highest band (£750,001 and above) accounts for less than one per cent of returns received and 26 per cent of tax.
Figure 4 shows that there has been an upward shift in the distribution of residential conveyances in each year, i.e. a decreasing proportion of returns in the £0 to £145,000 band each year and increasing proportions of returns received in all higher bands, becoming steeper in 2020/21. This is consistent with the increase in average residential property prices reported by Registers of Scotland year on year from 2016/17 to 2019/20, and a sharper increase in average residential property prices following the initial disruption of COVID-19 in 2020/21.
The share of revenue (Figure 5) contributed by the top two tax bands increased in 2020/21 due to the temporary change to the nil rate threshold, effective from 15 June 2020 to 31 March 2021, which had the effect of reducing tax liabilities in the second-lowest residential tax band (consideration from £145,000 to £250,000) to zero, and reducing gross tax liabilities for all other residential transactions by £2,100.
Figure 6: Average (mean) LBTT excluding ADS declared due for residential conveyances by residential LBTT band and month, 2019/20 and 2020/21
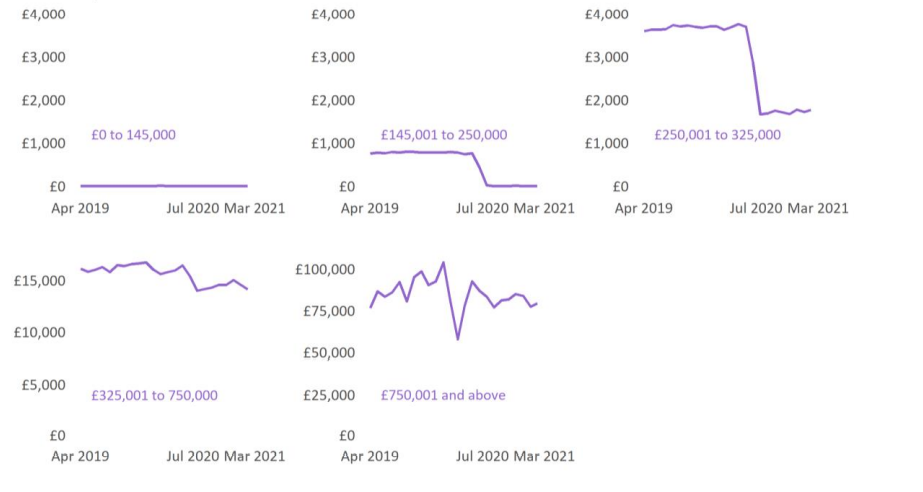
Figure 6 illustrates the effect of the temporary tax band change on average LBTT declared due within each tax band. The impact of the £2,100 reduction in LBTT due for transactions over £250,000, effective from 15 June 2020, is clearly visible in the two tax bands from £250,000 to £750,000. Average LBTT declared due for transactions above £750,000 is more volatile due to being dominated by a small number of large transactions which vary significantly in value.
Due to the structure of the tax, a small shift in residential property prices typically results in a larger change in tax revenues.
Figure 7: Distribution of numbers of residential conveyance transactions by total consideration, 2020-21
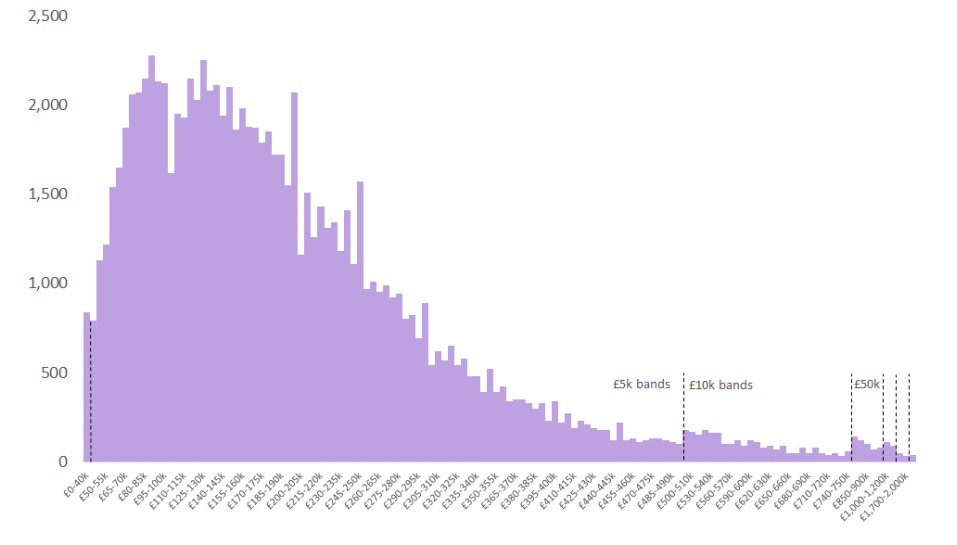
Figure 7 shows a more detailed breakdown of the number of residential conveyance transactions by total consideration (e.g. house price) for transactions that took place in 2020-21. The majority of transactions are towards the lower end of the scale (approximately two-thirds are less than or equal to £220k), with the distribution then extending to a long tail of higher value transactions. Due to the smaller numbers of transactions at the higher value end, the width of the total consideration categories is increased at the points indicated on the chart. Price point effects are visible around £100,000, £200,000, £250,000 and £300,000, reflecting a preference for round number values.
2.3 Additional Dwelling Supplement
Table 3: Gross ADS declared due, number of LBTT returns received with ADS declared due and value and number of repayments claimed by year for residential conveyances
| Gross ADS declared (£ Millions) | LBTT returns received with ADS declared due | |||||
| Total | Reclaimed1 | Reclaimed (%)1 | Total | Repayments claimed1 | Repayments claimed (%)1 | |
| 2016/17 | 103.0 |
27.1 |
26.3% | 20,830 | 3,640 | 17.5% |
| 2017/18 | 122.1 | 31.5 | 25.8% | 23,530 | 4,050 | 17.2% |
| 2018/19 | 128.1 | 35.6 | 27.8% | 23,620 | 4,360 | 18.5% |
| 2019/20 | 163.5 | 44.1 | 27.0% | 23,230 | 4,100 | 17.7% |
| 2020/21 | 153.9 | 29.3 | 19.0% | 20,790 | 2,540 | 12.2% |
Notes: 1. The data reflects claims for repayment of ADS received up to and including 31 May 2021 and will be revised over time as more claims for repayment of ADS are received, primarily for returns received in 2019/20 and 2020/21. In May 2020, the period for reclaiming ADS was extended for buyers who bought a new main residence effective between 24 September 2018 and 25 March 2020. ADS reclaims relating to transactions in 2018/19 and 2019/20 can therefore be expected continue into 2021/22.
Approximately £154 million in gross ADS was declared due in 2020/21, a decrease of approximately £10 million (6 per cent) on the previous year. The sharp (28 per cent) increase in ADS declared due from 2018/19 to 2019/20 was due largely to the increase in the ADS rate from 3 per cent to 4 per cent effective from 25 January 2019.
Approximately 20,800 residential LBTT returns received in 2020/21 had ADS declared due, equating to 21 per cent of all residential conveyances received, a similar proportion to previous years (22 per cent in 2019/20).
Approximately 12 per cent of taxpayers who submitted LBTT returns with ADS declared due in 2020/21 have since claimed repayment of ADS, accounting for 19 per cent of the gross ADS declared due. The ADS reclaim rate for 2020/21 appears lower than previous years. However, this figure will continue to increase over time as more claims for repayment are made. Only minimal revisions are expected to repayment claims relating to returns made up to 2018/19. Of these, approximately 18 per cent of ADS returns have since been reclaimed, accounting for 27 per cent of the gross ADS declared due. This indicates that claims are more likely to relate to higher value transactions.
During the coronavirus pandemic in 2020, legislation was introduced to extend the ADS repayment claim period for residential transactions which were still within their original ADS repayment claim period at the start of the restrictions, from 18 months to 36 months. This means that some returns relating to 2018/19 and 2019/20 may still be eligible for ADS repayment claims in 2021/22 and 2022/23. However, the majority of repayment claims are still expected to be made within one year.
Figure 8: Proportion of gross ADS declared due subsequently reclaimed and LBTT returns received with ADS declared due and a subsequent claim for repayment, by month for residential conveyances
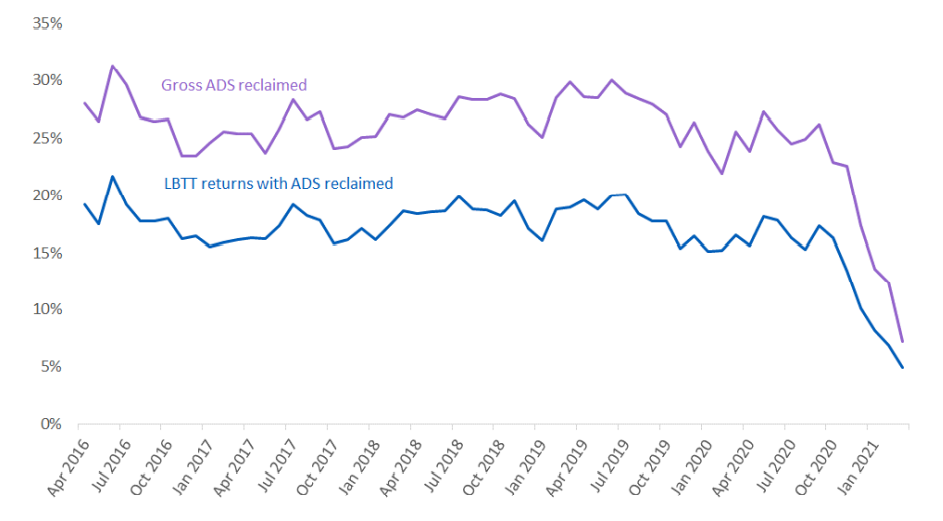
Figure 8 shows the proportion of gross ADS declared due that was subsequently reclaimed and the proportion of LBTT returns received with ADS declared due and a subsequent claim for repayment, by month of the original return, for residential conveyances. The gross ADS reclaimed rises from 7 per cent for the most recent month (7 per cent of ADS declared due in March 2021 was reclaimed by end May 2021) to around 27 per cent for the first 44 months (April 2016 to November 2019). This is a reflection of the fact that ADS taxpayers from earlier months have had 18 months from the effective date8 of the transaction subject to ADS to sell their previous main residence and then reclaim ADS. Similarly, the number of claims for repayment of ADS rises from 5 per cent for the most recent month (March 2021) to around 18 per cent for the first 44 months (April 2016 to November 2019).
Though taxpayers have 18 months from the effective date of the transaction subject to ADS to sell their previous main residence and reclaim ADS, it should be noted that the majority of claims for repayment of ADS are received well within this 18 month period.
Figure 9: Proportion of ADS reclaimed and reclaims received by the number of weeks between submission of the LBTT return and the claim for repayment, for returns with ADS declared due submitted 2016/17 to 2020/21
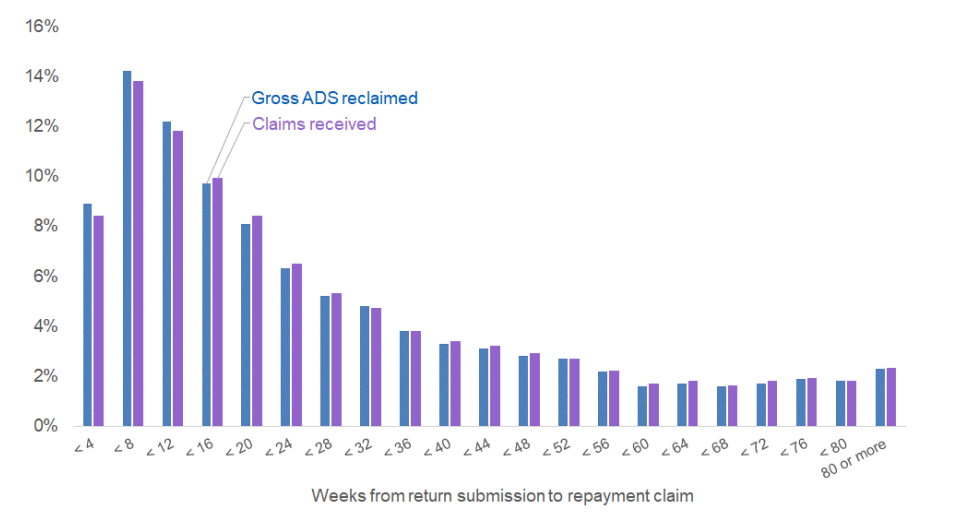
Figure 9 shows the proportion of gross ADS (tax) reclaimed and the proportion of claims (transactions) received by the number of weeks between the claim for repayment and original submission of the LBTT return. Approximately 8 per cent of claims are received within four weeks, over half of all claims are received within 20 weeks and approximately 85 per cent of all claims are received within a year. There is no obvious distinction between the distributions for claims received and gross ADS reclaimed. This suggests that claims for repayment associated with higher value transactions are no more likely to be received earlier (or later) than those for lower value transactions.
The LBTT return asks taxpayers declaring ADS due about their intention to reclaim ADS, i.e. do they intend to reclaim the ADS or not.
Table 4: Number of LBTT returns received with ADS declared due and the proportion with a subsequent claim for repayment by year, by the taxpayer’s stated intention to reclaim ADS for residential conveyances
| LBTT returns received with ADS declared due | Proportion with a subsequent claim for repayment | |||||
| Yes, intend to reclaim ADS | No intention to reclaim ADS | Total | Yes, intend to reclaim ADS | No intention to reclaim ADS | All | |
| 2016/17 | 5,300 | 15,530 | 20,830 | 64.6% | 1.4% | 17.5% |
| 2017/18 | 5,950 | 17,580 | 23,530 | 64.0% | 1.4% | 17.2% |
| 2018/19 | 5,830 | 17,790 | 23,620 | 67.9% | 2.3% | 18.5% |
| 2019/20 | 4,870 | 18,360 | 23,230 | 70.4% | 4.5% | 18.3% |
| 2020/21 | 4,220 | 16,570 | 20,790 | 63.4% | 3.2% | 15.4% |
Notes: 1. The data reflects claims for repayment of ADS received up to and including 31 May 2021 and will be revised over time as more claims for repayment of ADS are received, primarily for returns received in 2019/20 and 2020/21. In May 2020, the period for reclaiming ADS was extended for buyers who bought a new main residence effective between 24 September 2018 and 25 March 2020. Revisions relating to 2018/19 and 2019/20 can be expected in 2021/22.
For LBTT returns submitted with ADS declared due in 2019/20 around 70 per cent of taxpayers who stated that they intended to reclaim ADS subsequently went on to do so, slightly higher than previous years (around 65 per cent). Up to 2018/19, less than 2 per cent of taxpayers who stated they did not intend to reclaim ADS subsequently went on to do so; in 2019/20 this figure increased to 4.5 per cent and in 2020/21 it remained elevated at 3.2 per cent.
These figures indicate that a substantial proportion (around 30 per cent at its lowest in 2019/20) of taxpayers who stated that they intended to reclaim ADS did not subsequently do so. However, when a taxpayer had stated that they did not intend to reclaim ADS then it was unlikely that they subsequently submitted a claim for repayment.
Figure 10: Distribution of residential conveyances by type of transaction (ADS declared due and intends/does not intend to reclaim ADS, or no ADS declared due) and residential LBTT band, 2016/17 to 2020/21
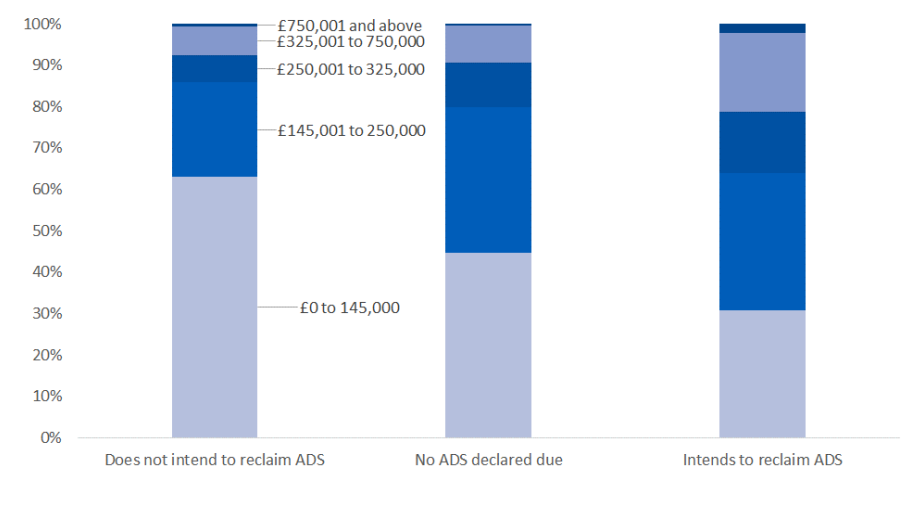
Figure 10 shows the distribution of residential conveyances by tax band and whether the taxpayer intended to reclaim any ADS declared due. There is a clear divergence between the distributions. Residential conveyances with ADS declared due where the taxpayer does not intend to reclaim ADS are more likely to be lower value transactions. This is likely to reflect the fact that these transactions will include buy-to-let properties and second homes. Residential conveyances with ADS declared due where the taxpayer intends to reclaim ADS tend to be higher value transactions. This is likely to reflect a number of factors including the fact that these transactions will include taxpayers who may be moving up the property ladder (as they intend to replace their previous main residence).
2.4 Non-residential conveyances
In this section we summarise the trends in LBTT declared due for non-residential conveyances and the number of non-residential conveyances received. Non-residential transactions also include leases and reviews of a lease, which are analysed separately in sections 2.5 and 2.6 respectively.
Table 5: LBTT declared due and number of LBTT returns received by year for non-residential conveyance
| 2015/16 | 2016/17 | 2017/18 | 2018/19 | 2019/20 | 2020/21 | |
| LBTT declared due (£ Millions) | 189.6 | 154.9 | 178.1 | 168.8 | 173.1 | 125.8 |
| Annual percentage change in LBTT declared due | -18.3% | 15.0% | -5.2% | 2.5% | -27.3% | |
| LBTT returns received | 6,220 | 6,810 | 6,880 | 7,160 | 6,440 | 5,940 |
| Annual percentage change in LBTT returns received | 9.6% | 1.0% | 4.0% | -10.0% | -7.8% | |
| LBTT declared due per return received (£) | 30,500 | 22,700 | 25,900 | 23,600 | 26,900 | 21,200 |
Notes: 1. Rounded to the nearest £100.
Table 5 shows the LBTT declared due (including ADS) and number of LBTT returns received by year for non-residential conveyances. Although only making up 5 per cent of LBTT returns received, non-residential conveyances have accounted for approximately 27 per cent of LBTT declared due in the last two years (including ADS).
LBTT from non-residential conveyances was £126 million in 2020/21, a decrease of £47 million (27 per cent) compared to the previous year despite the number of LBTT returns received decreasing by only 8 per cent. This is the lowest annual figure since LBTT was introduced in 2015/16 and reflected, in particular, very low revenue at the start of the financial year when COVID stay-at-home measures were introduced.
Compared to residential LBTT, the value of LBTT from non-residential conveyances is highly volatile due to fluctuations in the small number of very high value transactions seen in each year.
Figure 11: LBTT declared due by month and year for non-residential conveyances
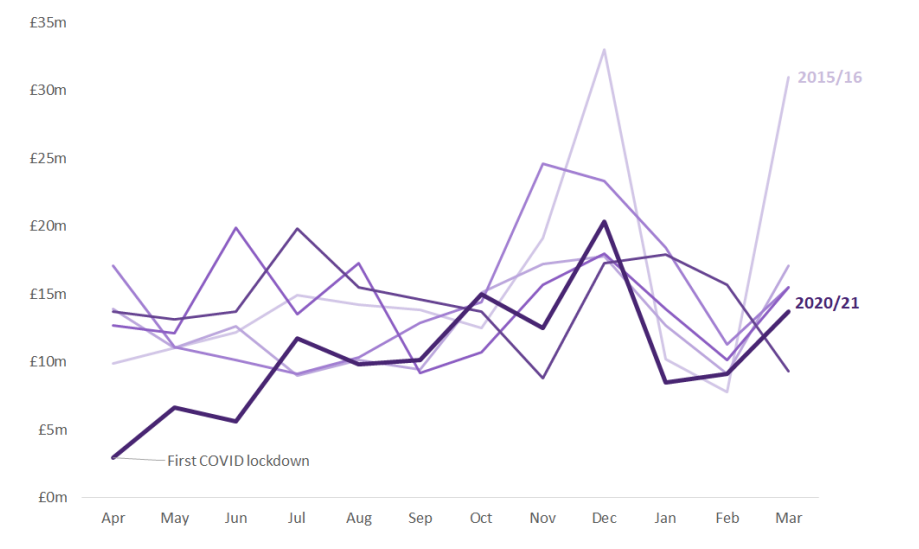
Figure 12: Number of non-residential conveyance returns received by month and year
In typical years, the number of non-residential conveyances received is relatively stable, with moderate peaks in November and December and March and April (perhaps linked to the ends of the calendar and financial years) and a slightly quieter period in January and February. This pattern was disrupted from March 2020 by the impact of the COVID-19 and the impact on businesses across Scotland. As a result, numbers of non-residential conveyances reached an all-time low of 260 in April 2020. This figure made a gradual recovery up to August 2020 and remained in line with previous years until jumping to a record high in March 2021.
LBTT declared due for non-residential conveyances is more variable than the number of LBTT returns received because a small number of high-value transactions can have a significant impact on the overall tax. However the period of March to June 2020 is visibly suppressed compared to previous years.
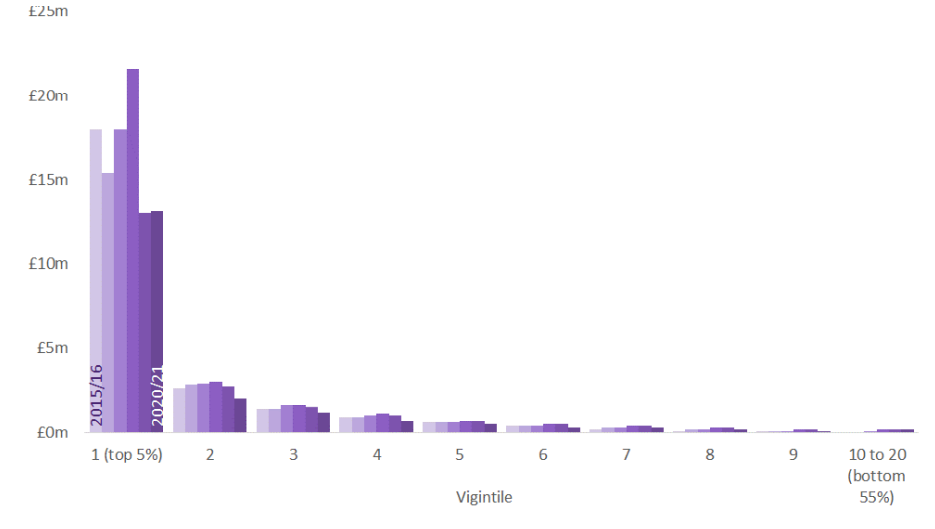
Figure 13: LBTT declared due by vigintile and year for non-residential conveyances
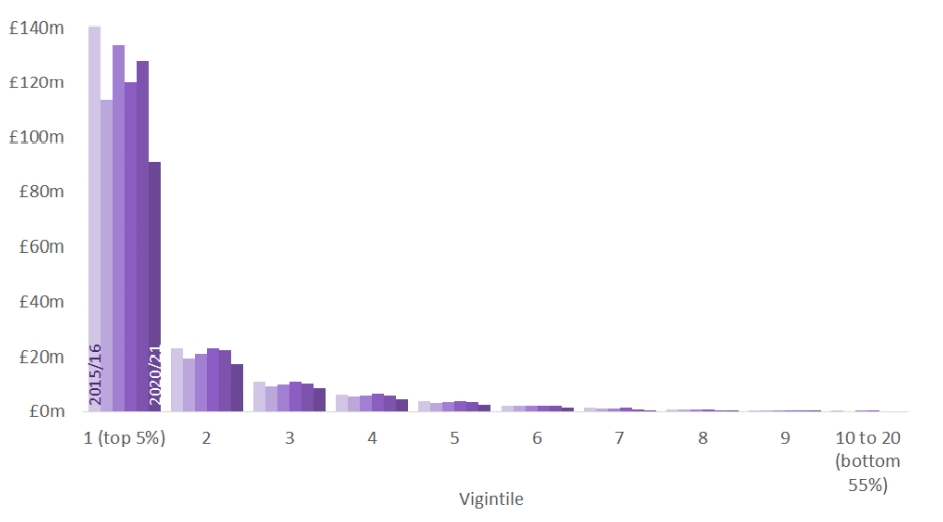
Figure 13 shows LBTT declared due by vigintile9 and year for non-residential conveyances. Each year the first vigintile accounts for approximately 71 to 75 per cent of LBTT declared due. In each year the top 20 per cent of transactions have accounted for over 95 per cent of LBTT declared due.
There are large annual variations in the value of LBTT declared due for the top 5 per cent of transactions and these variations account for the majority of the change in LBTT declared due. This has been particularly pronounced in 2020/21, with LBTT declared due for the top 5 per cent of transactions decreasing by £37 million (29 per cent) compared to the previous year.
2.5 Leases
In this section we summarise the trends in LBTT declared due for leases and the number of leases received. The vast majority (99 per cent) of leases are non-residential, but users should note that the analysis in this section includes a small number of leases which taxpayers have classified as residential on their tax returns. This may be a data quality issue as we would only expect a very small number of leases (close to zero) subject to LBTT to be classified for LBTT purposes as residential. Regardless, the overall tax position remains correct as the LBTT due for a lease transaction is the same whether it is a non-residential or residential lease.
For more information about leases, please see the relevant sections on our website.
https://www.revenue.scot/land-buildings-transaction-tax/leases
Table 6: LBTT declared due and number of LBTT returns received by year for leases
| 2015/16 | 2016/17 | 2017/18 | 2018/19 | 2019/20 | 2020/21 | |
| LBTT declared due (£ Millions) | 24.3 | 21.9 | 25.2 | 29.4 | 20.4 | 18.5 |
| Annual percentage change in LBTT declared due | -9.6% | 14.8% | 16.8% | -30.5% | -9.2% | |
| LBTT returns received | 5,260 | 5,690 | 5,570 | 5,130 | 4,920 | 3,500 |
| Annual percentage change in LBTT returns received | 8.2% | -2.1% | -7.9% | -4.1% | -28.8% | |
| LBTT declared due per return received (£) | 4,600 | 3,900 | 4,500 | 5,700 | 4,100 | 5,300 |
Notes: 1. Rounded to the nearest £100.
Leases have accounted for approximately 4 per cent of LBTT declared due and LBTT returns received during the first six years of LBTT.
£19 million in LBTT was declared due for leases in 2020 – the lowest so far and a decrease of £2 million (9 per cent) from 2019/20, while the number of lease returns received decreased by 29 per cent. Although there is historically high variation in LBTT from leases, the significant drop in 2020/21 is likely to reflect the impact of the COVID-19 pandemic.
Figure 14: LBTT declared due by month and year for leases
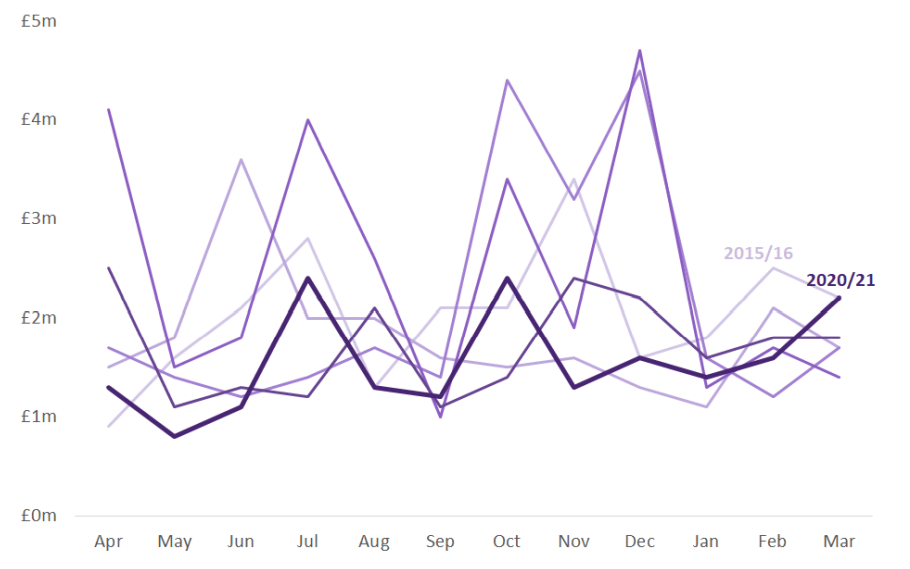
Figure 15: Number of lease returns received by month and year
Similarly to non-residential conveyances, the number of lease returns received tends to be highest in November and March/April, perhaps linked to the ends of the calendar and financial years. Unlike conveyances, of which generally fewer returns are received in January and February, there is no obvious low season for leases. Throughout 2020/21, numbers of lease returns have been noticeably lower than in the same months of previous years, with the exception of March 2020, when the COVID-19 related reduction in transactions was already becoming apparent.
LBTT declared due for leases shows similar high variability to non-residential conveyances and a small number of high value transactions can have a significant impact on the overall tax.
Figure 16: LBTT declared due by vigintile and year for leases
Each year from 2015/16 to 2018/19, the top five per cent of lease transactions accounted for approximately 70 to 74 per cent of LBTT declared due for leases, falling to 63 per cent in 2019/20. In 2020/21, revenue collected from the bottom 95 per cent of leases decreased, and the top five per cent of leases once more made up 70 per cent of all LBTT on leases.
LBTT may be due on a lease in relation to the net present value of rent, and/or on other chargeable considerations, such as payment of a premium to secure the lease. From 2015/16 to 2020/21, an estimated 84 per cent of all LBTT declared due on leases was due to rent, with the remaining 16 per cent due to premiums. LBTT due on premiums is dominated by a small number of large premiums over £350,000. Less than 1 per cent of leases fall into this top band of tax on premiums, contributing 94 per cent of all LBTT declared due on premiums. LBTT due on the rental value of leases is more widespread; 52 per cent of leases declared some amount of LBTT due on rent, increasing steadily from 45 per cent of notifiable leases in 2015/16 to 59 per cent in 2020/21.
Table 7: LBTT declared due for leases by taxable component
| 2015/16 | 2016/17 | 2017/18 | 2018/19 | 2019/20 | 2020/21 | ||
| Lease returns received |
LBTT due on rent | 2,350 | 2,660 | 2,730 | 2,850 | 2,820 | 2,060 |
| No LBTT due on rent | 2,910 | 3,020 | 2,810 | 2,270 | 2,110 | 1,450 | |
| LBTT due on a premium of £350,001 or more | 30 | 20 | 30 | 30 | 20 | 20 | |
| No LBTT due on Premium | 4,930 | 5,320 | 5,120 | 4,870 | 4,660 | 3,260 | |
| Total | 5,250 | 5,690 | 5,540 | 5,130 | 4,920 | 3,500 | |
| LBTT declared due (£ Millions) | ...on rent | 21.6 | 19.9 | 18.0 | 21.6 | 18.7 | 17.4 |
| ...on premiums | 2.7 | 1.6 | 7.2 | 7.8 | 1.7 | 1.1 |
Notes:
1 The value of LBTT declared due on rent or on premiums is scaled to sum to the total LBTT declared due after reliefs, while preserving the ratio of LBTT declared due on rent to LBTT declared due on premium within each individual return. 2 Count of all lease returns declaring a non-zero amount of LBTT due on net present value of rent, after scaling to match the total LBTT declared due after reliefs. 3 Count of all lease returns declaring a non-zero amount of LBTT due on a premium declared greater than £350,000, after adjusting the LBTT declared due on a premium to match the total LBTT declared due after reliefs. 4 This table has been produced for the first time in the 2020/21 publication based on data as at May 2021. Totals for earlier years may not exactly match other figures in this publication which have been fixed after 24 months.
2.6 Reviews of a lease
In this section we summarise the trends in LBTT declared due for reviews of a lease (threeyearly reviews, assignations and terminations) and the number of reviews of a lease received from 1 April 2018 to 31 March 2021. The first three-yearly reviews of lease transactions became due from 1 April 2018. Assignations and terminations were received prior to 1 April 2018 but were not distinguished from lease transactions prior to this date. The first six-year reviews of lease transactions became due from 1 April 2021; these figures for three-yearly lease reviews include some reviews submitted early for six-year reviews due after 31 March 2021.
Table 8: LBTT declared due and number of returns received for reviews of a lease by type of review and the amount due
| Type of Review | Change | LBTT declared due (£ Millions) | Reviews received | ||||
| 2018/19 | 2019/20 | 2020/21 | 2018/19 | 2019/20 | 2020/21 | ||
| Assignation | Increase | 0.0 | 0.0 | 0.3 | 20 | 60 | 60 |
| No change | 0.0 | 0.0 | 0.0 | 200 | 240 | 220 | |
| Decrease | 0.0 | -0.1 | -0.1 | 0 | 30 | 40 | |
| All | 0.0 | 0.0 | 0.2 | 220 | 330 | 320 | |
| Termination | Increase | 0.0 | 0.0 | 0.0 | 20 | 30 | 20 |
| No change | 0.0 | 0.0 | 0.0 | 230 | 280 | 180 | |
| Decrease | -0.3 | -0.5 | -0.6 | 60 | 110 | 110 | |
| All | -0.2 | -0.4 | -0.5 | 320 | 420 | 310 | |
| Three-year lease review | Increase | 1.0 | 1.3 | 0.5 | 410 | 540 | 370 |
| No change | 0.0 | 0.0 | 0.0 | 3,020 | 3,070 | 1,730 | |
| Decrease | -0.8 | -0.2 | -0.2 | 250 | 220 | 170 | |
| All | 0.2 | 1.0 | 0.3 | 3,680 | 3,830 | 2,270 | |
| All | Increase | 1.0 | 1.3 | 0.9 | 450 | 630 | 440 |
| No change | 0.0 | 0.0 | 0.0 | 3,460 | 3,580 | 2,130 | |
| Decrease | -1.0 | -0.8 | -0.8 | 310 | 350 | 320 | |
| All | 0.0 | 0.6 | 0.0 | 4,220 | 4,570 | 2,900 |
Table 8 shows the LBTT declared due for reviews of a lease by type of review and the amount due. Where a review return declares a decrease from the amount due for the original lease return, this reflects a claim for repayment. Three-yearly lease reviews resulted in net LBTT declared due of £0.3 million in 2020/21. This consisted of £0.5 million in further LBTT due and £0.2 million of repayments claimed. Lease assignations resulted in a further net LBTT declared due of £0.2 million. Three-yearly lease reviews and assignations were balanced out by lease terminations which resulted in a net repayment of £0.5 million, bringing the overall net LBTT declared due for all reviews of a lease to approximately nil.
Approximately 2,900 reviews of a lease were received in 2020/21, of which 73 per cent declared no change in the LBTT due from the original lease return (i.e. the LBTT declared due on review was £0), 15 per cent declared further LBTT due and 11 per cent claimed a repayment of LBTT. Three-yearly lease reviews accounted for 78 per cent of reviews of a lease received, with terminations and assignations accounting for 11 per cent each. The total number of lease reviews received was 37 per cent lower than the previous year, driven primarily by a 41 per cent drop in the number of three-yearly lease reviews.
2.7 Sub-Scotland
Revenue Scotland does not routinely (i.e. as part of its monthly LBTT Official Statistics publications) publish information on LBTT for geographies smaller than the whole of Scotland. However, we are aware of the wide interest in this data and are committed to publishing annual information on LBTT revenue declared due and returns received by Sub-Scotland geographies in this annual publication.
Whilst data at the national level is finalised after 24 months, data for smaller areas is finalised after 12 months. This decision has been taken as a result of the risk of disclosing protected taxpayer information relating to individual people or businesses.
As noted in previous editions of this publication, the sub-Scotland data has historically presented challenges as a result of the incompleteness and inaccuracies in address information on tax returns. Following the introduction of the new Scottish Electronic Tax System in July 2019, there was a marked increase in the improvement of address data in the second half of 2019/20. This improvement in data quality has been sustained, with 98 per cent of residential conveyance returns and 67 per cent of non-residential conveyance returns received in 2020/21 having a valid postcode.
In order to provide estimates of LBTT revenue declared due and returns received by sub-Scotland geographies, Revenue Scotland has adopted the following method to determine a valid postcode for a return.
- If a valid property postcode is provided on the tax return, this postcode is used.
- If no valid postcode is provided, where possible the return is linked to data provided by Registers of Scotland and geographical information associated with the title registration is used.
- If neither of the above are possible then the geographical information is imputed by finding a suitable “donor” record for which a valid property postcode is available. The “donor” record is chosen based on similarity to the "recipient" record with respect to other information on the tax return.
This method provides robust estimates for residential and non-residential conveyances. The estimates for residential conveyances are more reliable because residential conveyance returns are more likely to include a valid postcode and more likely to match to a title registered with Registers of Scotland. For the estimates presented here of returns submitted in 2020/21, location was imputed for less than 1 per cent of residential returns and 12 per cent of non-residential returns.
The method described above is not effective for leases as we do not have an alternative source to match these transactions to. Therefore, sub-Scotland estimates are only provided for residential and non-residential conveyances.
Full details of the method used to produce the estimates can be found on the LBTT data requests section10 of the Revenue Scotland website.
Revenue Scotland would like to thank Registers of Scotland for the support provided for this work. Users should again note that these estimates are not a commentary on the volume or value of land and property transactions in Scotland. Registers of Scotland publish comprehensive property data for Scotland and is the definitive source of data on the property market.
https://www.ros.gov.uk/data-and-statistics
2.7.1 Sub-Scotland: Residential LBTT
Figure 17: Estimates of LBTT excluding ADS declared due for residential conveyances by local authority and year
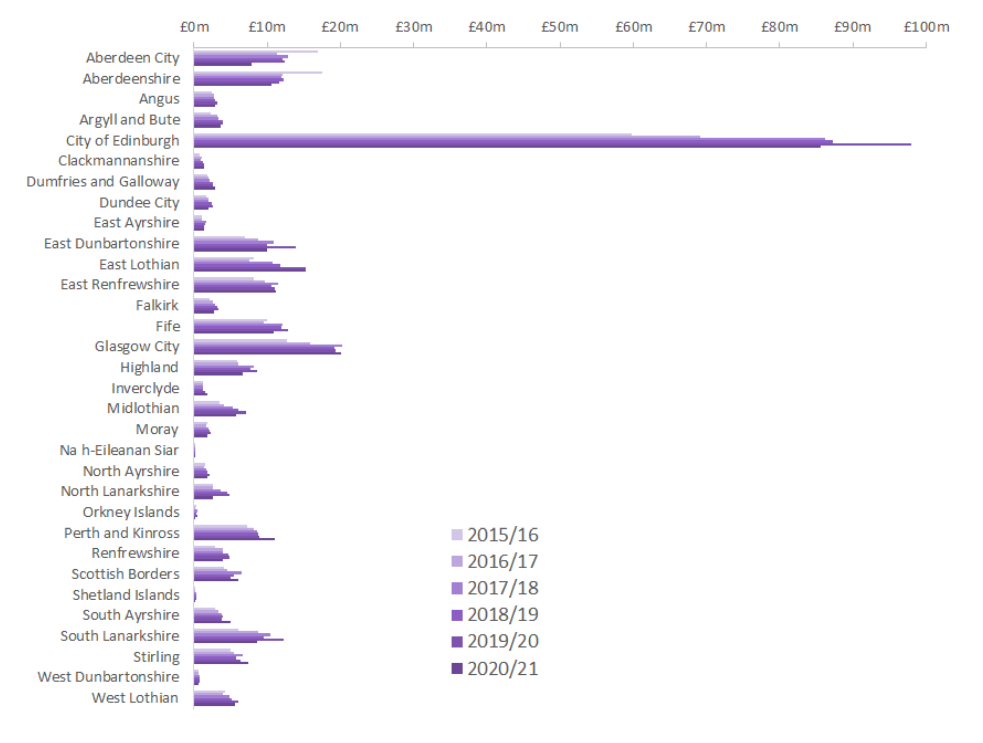
In 2020/21, City of Edinburgh accounted for £86 million (33 per cent) of LBTT excluding ADS declared due, more than four times greater than any other local authority. Glasgow City accounted for £20 million (8 per cent), the second highest of all local authorities. City of Edinburgh has accounted for 30 to 34 per cent of LBTT revenue excluding in each of the last six years. No other local authority has ever accounted for more than 9 per cent.
From 2019/20 to 2020/21, LBTT revenues decreased across 21 of the 32 authorities with the largest absolute drop in City of Edinburgh, where £12 million less LBTT was declared than the previous financial year. The greatest absolute increase in 2020/21 was recorded in Perth and Kinross, where LBTT revenue increased by £2 million (24 per cent) from 2019/20.
Figure 18: Estimated number of residential conveyance returns received by local authority and year
Glasgow City accounted for most residential conveyance returns received in 2020/21 with 10,800 returns (11 per cent of the Scotland total), marginally ahead of City of Edinburgh with 10,400 returns (11 per cent).
Numbers of residential conveyances decreased across 26 of the 32 local authorities from 2019/20 to 2020/21, with City of Edinburgh showing the largest absolute drop of 1,400 fewer conveyances than the previous year. Where more returns were received than the previous year this was a marginal increase, never more than around 1 per cent of the number of returns received in 2019/20.
2.7.2 Sub-Scotland: Additional Dwelling Supplement
Figure 19: Estimates of gross ADS declared due for residential conveyances by local authority, intention to reclaim ADS and year
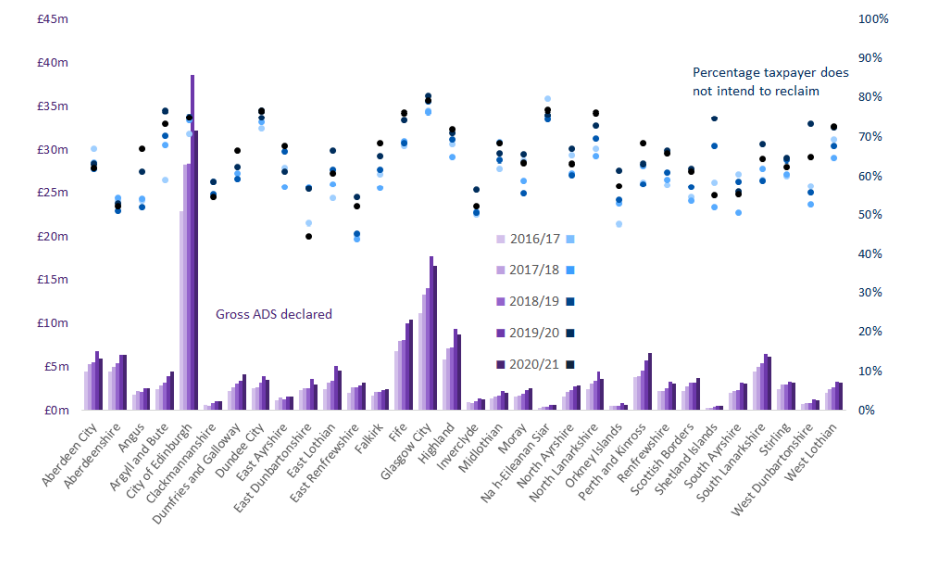
Sub-Scotland: Additional Dwelling Supplement
Figure 19 shows estimates of gross ADS declared due for residential conveyances, and intention not to reclaim ADS, by local authority and year. City of Edinburgh accounted for most gross ADS declared due in 2019/20 with £32 million, 21 per cent of the Scotland total, but a £6 million (17 per cent) decrease on the previous year. Glasgow City accounted for the second-largest share of ADS, with £17 million declared due, 11 per cent of the Scotland total. Edinburgh tends to dominate LBTT excluding ADS declared due (33 per cent of the Scotland total) more than gross ADS (21 per cent of the Scotland total) (see Figure 17). This is because the ADS rate is flat whereas the LBTT rate excluding ADS is progressive, hence the effective tax rate (i.e. the ratio of LBTT excluding ADS due to total consideration) increases with total consideration.
Taxpayers stating that they do not intend to reclaim ADS accounted for £24 million (75 per cent) of the gross ADS declared due in City of Edinburgh, and £13 million (79 per cent) of the gross ADS declared due in Glasgow City. The proportion of gross ADS declared due by taxpayers stating that they do not intend to reclaim ADS was highest in Glasgow City (79 per cent) and lowest in East Dunbartonshire (45 per cent).
In 2020/21, for the first time since ADS was implemented in 2016, a majority of local authorities (18 out of 32) showed a decrease from the previous year in the proportion of ADS declared which taxpayers do not intend to reclaim, although in many cases the change was relatively small.
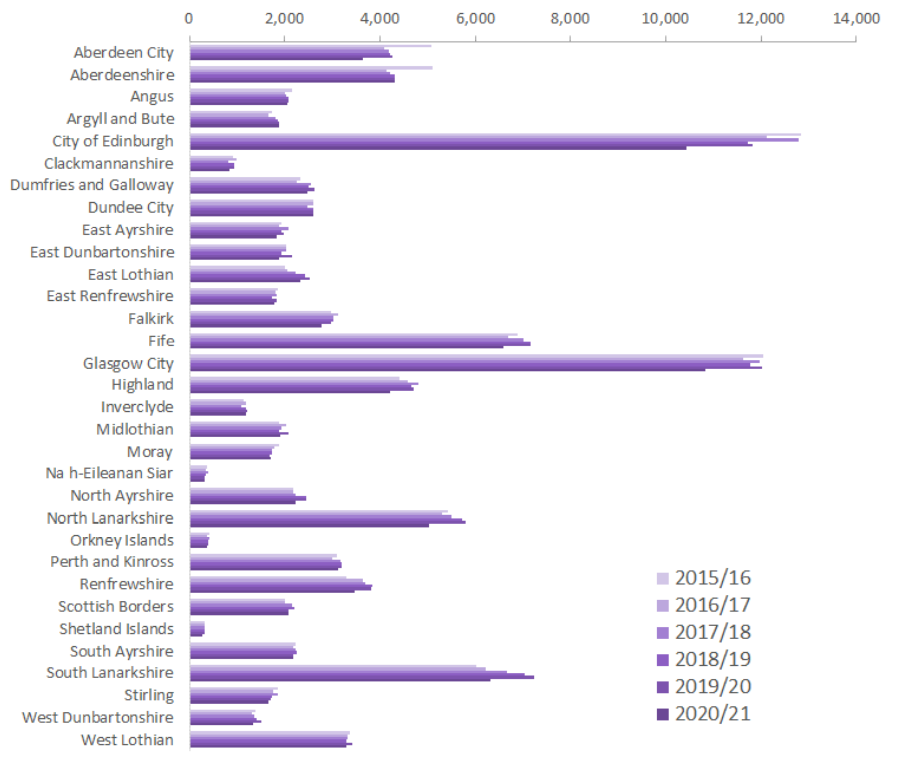
Figure 20: Estimated number of residential conveyance returns received with ADS declared due by local authority, intention to reclaim ADS and year
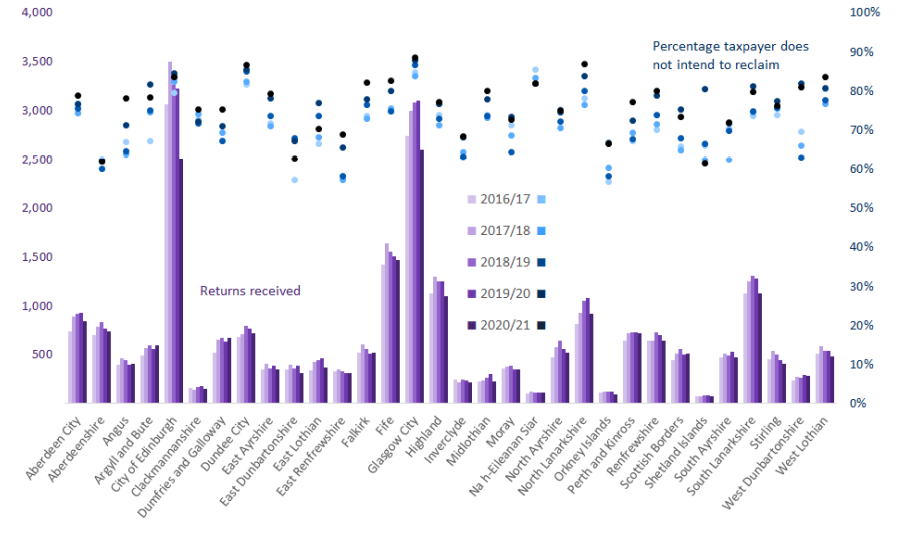
Figure 20 shows estimates of the number of LBTT returns received with ADS declared due, and intention not to reclaim ADS, by local authority and year. Glasgow City accounted for most residential conveyances received with ADS declared due in 2020/21 with 2,600 returns (12.5 per cent of the Scotland total), exceeding City of Edinburgh (12 per cent of the Scotland total) for the first time since LBTT was introduced.
Taxpayers stating that they do not intend to reclaim ADS accounted for 89 per cent (2,300) of LBTT returns received with ADS declared due in Glasgow City and 84 per cent (2,100) of LBTT returns received with ADS declared due in City of Edinburgh. The proportion of LBTT returns received with ADS declared due where the taxpayer has stated that they do not intend to reclaim ADS was highest in Glasgow City (89 per cent) and North Lanarkshire (87 per cent) and lowest in Shetland Islands and Aberdeenshire (both 62 per cent).
2.7.3 Sub-Scotland: Residential conveyances not replacing a main residence
Figure 21: Estimates of the percentage (%) of all residential conveyance returns received where the taxpayer did not intend to reclaim ADS declared due, by local authority and year
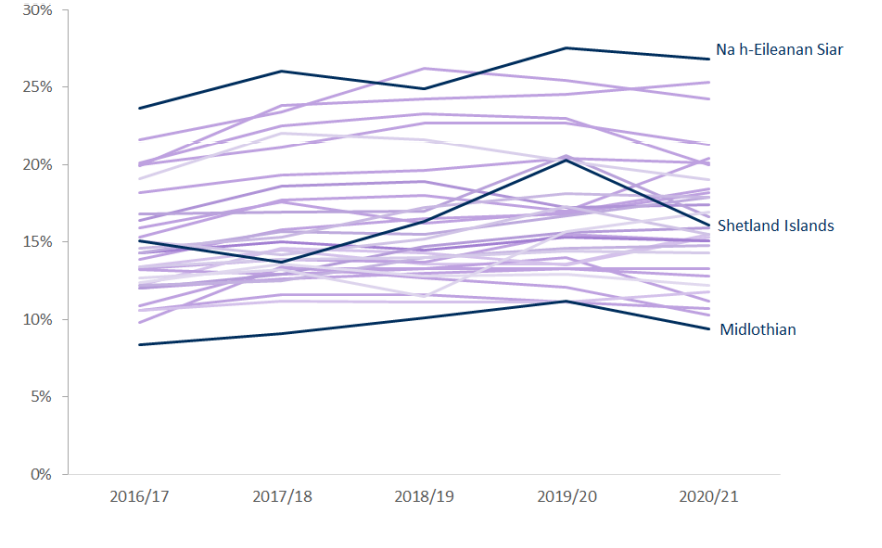
Figure 21 and Table 9 show estimates of the percentage of all residential LBTT returns received where the taxpayer does not intend to reclaim the ADS declared due, by local authority and year. This is an indicative measure of the percentage of all residential conveyances where the taxpayer (individual or organisation) is purchasing an additional property (e.g. buy-to-let dwelling or a second home) rather than replacing their main residence. In 2020/21 this was highest in Na h-Eileanan Siar (27 per cent of all residential transactions) and Argyll and Bute (25 per cent), and lowest in Midlothian (9 per cent), East Dunbartonshire (10 per cent), and Aberdeenshire (11 per cent). This figure has decreased in 19 local authorities between 2019/20 to 2020/21 with the greatest drop in Shetland Islands, from 20 per cent in 2019/20 to 16 per cent in 2020/21.
Table 9: Estimates of the percentage (%) of all residential conveyance returns received where ADS was declared due and the taxpayer did not intend to reclaim ADS, by local authority and year
| Local authority | Percentage(%) of all residential LBTT returns received where ADS is declared due and the taxpayer does not intend to reclaim ADS | ||||
| 2016/17 | 2017/18 | 2018/19 | 2019/20 | 2020/21 | |
| Aberdeen City | 13.9% | 15.8% | 16.5% | 16.8% | 18.2% |
| Aberdeenshire | 10.6% | 11.6% | 11.6% | 11.1% | 10.7% |
| Angus | 13.4% | 14.5% | 13.6% | 13.6% | 15.4% |
| Argyll and Bute | 19.9% | 23.8% | 24.2% | 24.5% | 25.3% |
| City of Edinburgh | 20.1% | 22.5% | 23.3% | 23.0% | 20.0% |
| Clackmannanshire | 12.0% | 12.6% | 13.0% | 13.3% | 13.3% |
| Dumfries and Galloway | 15.3% | 17.7% | 18.0% | 17.0% | 20.4% |
| Dundee City | 21.6% | 23.4% | 26.2% | 25.4% | 24.2% |
| East Ayrshire | 13.3% | 13.9% | 13.7% | 15.5% | 15.1% |
| East Dunbartonshire | 9.8% | 13.4% | 12.7% | 12.1% | 10.2% |
| East Lothian | 10.9% | 13.3% | 13.3% | 14.0% | 11.2% |
| East Renfrewshire | 10.6% | 11.2% | 11.1% | 11.1% | 11.8% |
| Falkirk | 12.2% | 14.6% | 14.3% | 13.5% | 15.3% |
| Fife | 15.9% | 17.6% | 16.2% | 16.9% | 18.4% |
| Glasgow City | 20.0% | 21.1% | 22.7% | 22.7% | 21.3% |
| Highland | 18.2% | 19.3% | 19.6% | 20.4% | 20.1% |
| Inverclyde | 13.2% | 12.9% | 13.3% | 13.3% | 12.8% |
| Midlothian | 8.4% | 9.1% | 10.1% | 11.2% | 9.4% |
| Moray | 14.3% | 15.0% | 14.5% | 15.3% | 15.1% |
| Na h-Eileanan Siar | 23.6% | 26.0% | 24.9% | 27.5% | 26.8% |
| North Ayrshire | 16.4% | 18.6% | 18.9% | 17.2% | 17.4% |
| North Lanarkshire | 12.0% | 12.9% | 14.7% | 15.6% | 15.9% |
| Orkney Islands | 16.8% | 16.9% | 17.0% | 20.6% | 16.6% |
| Perth and Kinross | 14.3% | 15.7% | 15.5% | 16.7% | 18.0% |
| Renfrewshire | 12.2% | 12.5% | 14.0% | 14.6% | 14.9% |
| Scottish Borders | 14.6% | 15.3% | 17.2% | 18.1% | 17.9% |
| Shetland Islands | 15.1% | 13.7% | 16.3% | 20.3% | 16.1% |
| South Ayrshire | 15.1% | 14.2% | 15.2% | 17.3% | 15.5% |
| South Lanarkshire | 13.4% | 13.9% | 14.0% | 14.4% | 14.3% |
| Stirling | 19.1% | 22.0% | 21.6% | 20.2% | 18.9% |
| West Dunbartonshire | 12.7% | 13.2% | 11.5% | 15.7% | 17.0% |
| West Lothian | 12.4% | 13.6% | 12.8% | 12.9% | 12.2% |
2.7.4 Sub-Scotland: Residential tax bands
Figure 22: Distributions of residential LBTT returns by local authority and tax band, 2020/21
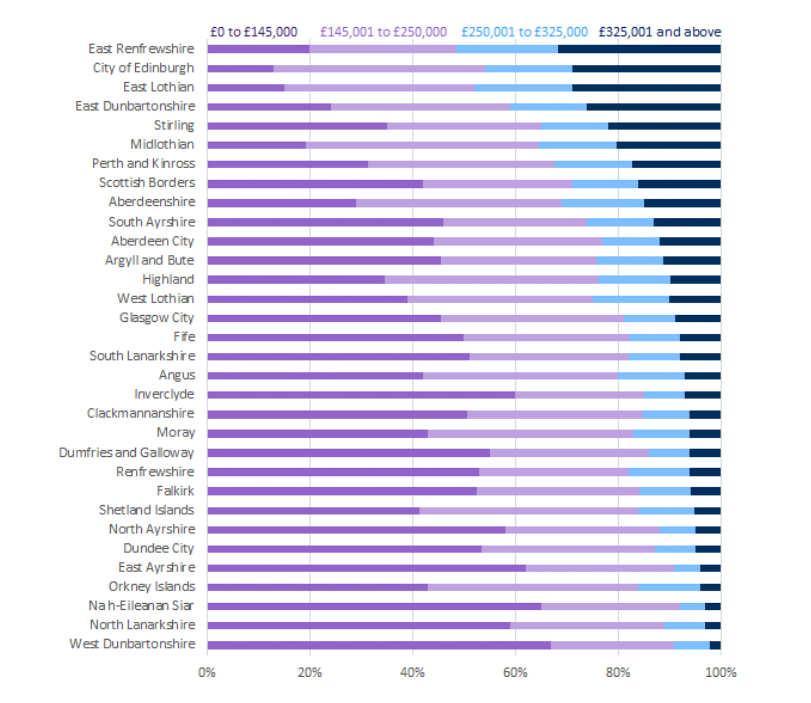
Figure 22 shows the distribution of residential transactions by tax band in each local authority for the 2020/21 tax year. The top two residential tax bands (£325,000 to £750,000 and £750,000 and above) are combined to protect taxpayer confidentiality. East Renfrewshire had the highest proportion of returns in the combined £325k+ tax band (32%), followed closely by City of Edinburgh and East Lothian (both 29%). Furthermore, East Renfrewshire was the only local authority in which the bottom two tax bands accounted for less than half of the total transactions (49%).
City of Edinburgh had the highest proportion of returns in the underlying top-rate £750k+ band, with 4% of transactions. Furthermore, City of Edinburgh accounted for one-half of all transactions in the top-rate band, with 410 transactions with a consideration over £750k out of the national total of 820 transactions.
West Dunbartonshire had the highest proportion (67%) of transactions in the lowest, nil rate, tax band (£0-145k). Of the 32 local authorities, 13 local authorities had at least 50% of transactions falling into the lowest band.
2.7.5 Sub-Scotland: Non-residential conveyances
Figure 23: Estimates of LBTT declared due by NUTS 2 area 11 and year for non-residential conveyances
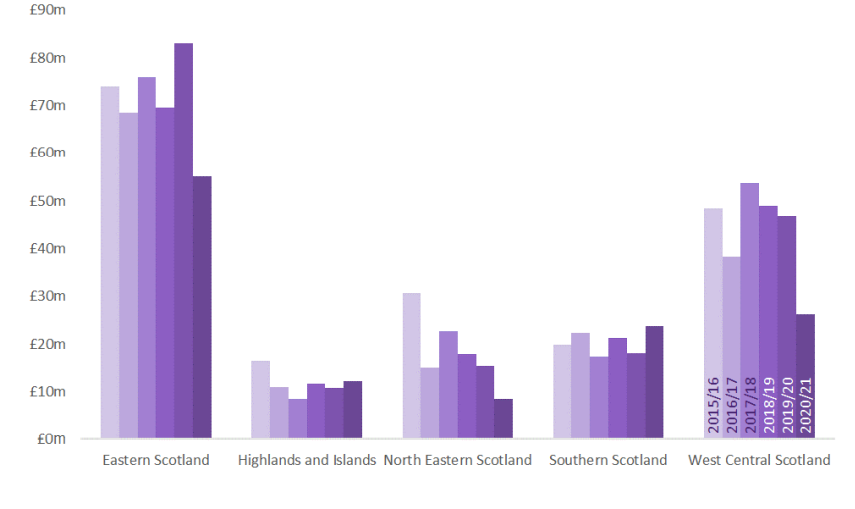
Figure 24: Estimated number of non-residential conveyance returns received by NUTS 2 area and year
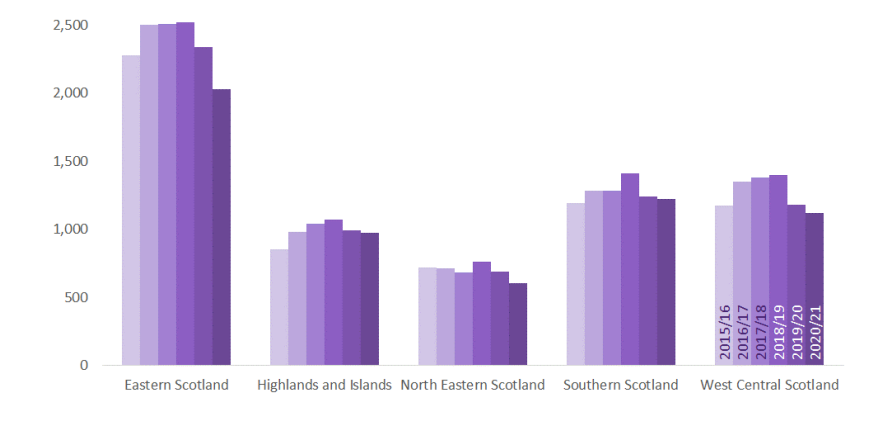
Sub-Scotland estimates of LBTT declared due and the number of LBTT returns received for non-residential conveyances are provided by NUTS 2 areas instead of local authority areas to minimise the risk of disclosing protected taxpayer information. Eastern Scotland has accounted for the largest segment of LBTT declared due (39 to 48 per cent) and transactions (34 to 37 per cent) in each of the last six years. From 2019/20 to 2020/21, LBTT revenue from non-residential conveyances fell in Eastern Scotland, West Central Scotland and North Eastern Scotland while remaining around the same level in Highlands and Islands and Southern Scotland. Care should be taken when interpreting annual changes in LBTT declared due by NUTS 2 areas as non-residential LBTT revenues can be influenced by small numbers of very large transactions which can lead to significant year-to-year changes.
2.8 Reliefs
Revenue Scotland does not routinely (i.e. as part of its monthly LBTT Official Statistics publications) publish information on reliefs claimed or LBTT revenue forgone to reliefs. However, we are aware of the wide interest in this data and are committed to publishing information on reliefs via this annual publication.
There are various data quality issues with reliefs information collected from LBTT returns in previous years, although these issues do not affect the total LBTT declared due.
The most common data quality issue affecting total revenue foregone to reliefs is that, prior to the introduction of a new electronic tax system in July 2019, four per cent of taxpayers claiming reliefs incorrectly entered the value of the relief claimed as the full consideration - e.g. the total price of the property – rather than the LBTT amount that would be due without reliefs. This means that simply summing the value of reliefs claimed on tax returns would overstate the value of LBTT revenue forgone to reliefs. The LBTT revenue forgone to reliefs needs to be estimated from other information provided by the taxpayer, and hence the results presented are referred to as estimates. Full details of the methods used to produce the estimates can be found on the LBTT data requests section12 of the Revenue Scotland website.
From 2015/16 to 2018/19, the relief amount was estimated in this way for 10 per cent of returns claiming a relief. Recent improvements to the tax system have reduced the need to estimate the relief amount, and in 2020/21, the relief amount was estimated for 1 per cent of returns.
It is also worth noting that the estimates are likely to underestimate ADS (and consequently LBTT) revenue forgone to reliefs to some extent. ADS is due on most purchases of a residential property by a non-natural person, such as a company. When a full relief is claimed reducing the LBTT liability to nil, in some cases the ADS has not been declared (rather than declared and reduced to nil by relief). Therefore, although the tax position is correct, it is likely that data on reliefs for residential transactions will underestimate ADS revenues forgone. There is a similar issue where a non-residential transaction contains a mixture of residential and commercial elements (‘mixed’ property transactions are treated as non-residential transactions for LBTT). Again, the overall tax position for the relevant transactions remains correct.
Table 10: Estimated LBTT revenue forgone to reliefs and the number of LBTT returns received in which LBTT revenue has been forgone to reliefs by year
| Year | LBTT revenue forgone (£ Millions) | Number of LBTT returns received in which LBTT revenue has been forgone to reliefs | ||||
| LBTT excluding ADS | ADS | All | LBTT excluding ADS | ADS | All | |
| 2015/16 | 124.0 | 0.0 | 124.0 | 1,600 | 0 | 1,600 |
| 2016/17 | 103.1 | 3.0 | 106.1 | 1,790 | 210 | 1,830 |
| 2017/18 | 86.6 | 6.2 | 92.8 | 1,950 | 250 | 2,020 |
| 2018/19 | 122.4 | 4.3 | 126.7 | 9,940 | 310 | 10,020 |
| 2019/20 | 106.2 | 5.7 | 111.9 | 15,390 | 410 | 15,530 |
| 2020/21 | 100.7 | 3.7 | 104.4 | 3,010 | 240 |
3,030
|
Notes:
1. ADS revenue forgone to reliefs is distinct from claims for repayment of ADS following the sale of the taxpayer's previous main residence. 2. An LBTT return may have LBTT excluding ADS and ADS revenue forgone to reliefs if both are due and relief is claimed. This column counts LBTT returns where LBTT excluding ADS or ADS revenue has been forgone to reliefs and, therefore, will not equal the sum of the previous two columns.
It is estimated that £104 million of LBTT revenue was forgone to reliefs in 2020/21, which represents a decrease of £8 million (7 per cent) on the previous year.
The number of LBTT returns received in which LBTT revenue has been forgone to reliefs increased each year until 2019/20, to around 16,000 LBTT returns in 2019/20, before dropping to around 3,000 in 2020/21. The main reason for this pattern is the impact of first-time buyer relief, which was introduced on 30 June 2018 and became temporarily ‘redundant’ from 15 July 2020 to 31 March 2021 due to the temporary change to the nil rate tax threshold. During this period no tax was due for transactions that would otherwise have claimed first time buyer relief. For further information on first-time buyer relief see the guidance published by Revenue Scotland.
ADS revenue forgone to reliefs13 is estimated to have accounted for 4 per cent of LBTT revenue forgone to reliefs since 2016/17.
Table 11: Estimated LBTT revenue forgone to reliefs and number of LBTT returns received in which LBTT revenue has been forgone to reliefs by type of property and year
| Year | LBTT revenue forgone (£ millions | Number of LBTT returns received in which LBTT revenue has been forgone to reliefs | ||||
| Residential | Non-residential | All | Residential | Non-residential | All | |
| 2015/16 | 15.4 | 108.6 | 124.0 | 900 | 700 | 1,600 |
| 2016/17 | 12.0 | 94.1 | 106.1 | 1,050 | 770 | 1,830 |
| 2017/18 | 12.2 | 80.6 | 92.8 | 1,190 | 840 | 2,020 |
| 2018/19 | 15.9 | 110.8 | 126.7 | 9,180 | 840 | 10,020 |
| 2019/20 | 17.3 | 94.6 | 111.9 | 14,740 | 790 | 15,530 |
| 2020/21 | 16.0 | 88.3 | 104.4 | 2,300 | 730 | 3,030 |
Non-residential transactions account for the majority of LBTT revenue forgone to reliefs with residential transactions making up only 13 per cent of LBTT revenue forgone to reliefs over the 6 year period. In contrast, residential transactions have accounted for the majority of LBTT returns received in which LBTT revenue has been forgone to reliefs – around 58 per cent for first 3 years, rising to 95 per cent in 2019/20 following the introduction of First Time Buyer relief in June 2018, and falling to 76 per cent in 2020/21 when First Time Buyer relief was essentially ‘redundant’ for part of the year due to the temporary increase in the nil rate band threshold.
Figure 25: Estimated LBTT revenue forgone to reliefs by type of relief and year
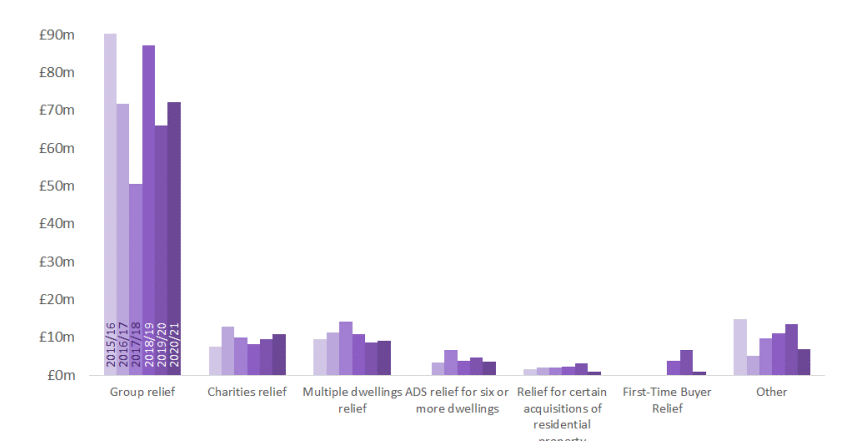
Group relief is estimated to have accounted for the majority (54 to 73 per cent) of revenue forgone each year. Changes in the total estimated LBTT revenue forgone to reliefs are largely driven by changes in revenue forgone to group relief.
Subject to certain rules, group relief provides relief from LBTT where, at the effective date, the seller and buyer are both companies in the same group. Where the rules are met, this allows companies to move property within a corporate group structure for commercial reasons without a liability for LBTT being incurred. For further information on group relief see the guidance published by Revenue Scotland14.
Users of this data should note that if group relief had been unavailable it is likely that many of the transactions that benefit from the relief would not have taken place.
Charities relief was second behind group relief in terms of LBTT revenue forgone to reliefs in 2020/21 and accounted for 10 per cent of the revenue forgone. For further information on charities relief see the guidance published by Revenue Scotland15 .
Figure 26: Estimated number of LBTT returns received in which LBTT revenue has been forgone to relief by type of relief and year
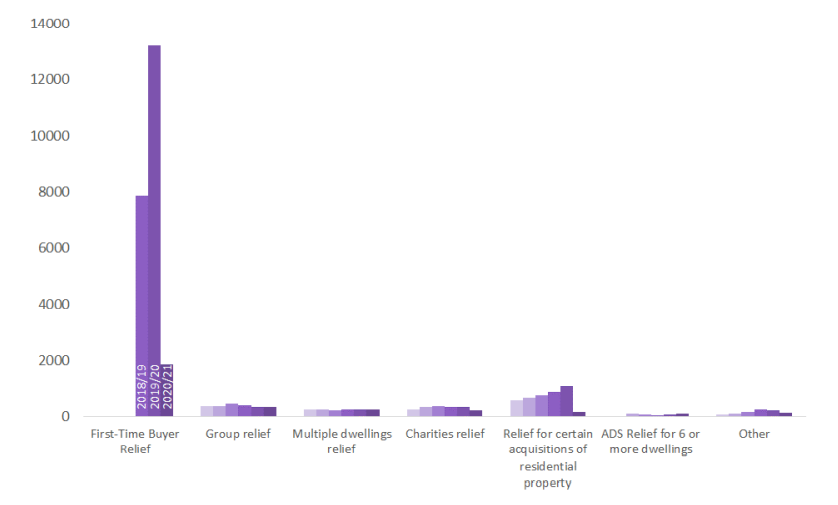
Since the introduction of First-Time Buyer Relief on 30 June 2018, this was the most frequently claimed relief, accounting for 13,200 (85 per cent of) LBTT returns received in which LBTT revenue was forgone to relief in 2019/20. Claims for First-Time Buyer relief dropped off dramatically in 2020/21, when the relief had no effect for most of the year due to the temporary increase to the nil rate threshold (15 July 2020 to 31 March 2021).
Despite accounting for the vast majority of claims for LBTT relief, Figure 25 shows that First-Time Buyer relief accounts for only a small portion of the estimated LBTT revenue foregone to reliefs – less than 1 per cent in 2020/21, and 6 per cent in 2019/20. This is because First-Time Buyer relief provides a maximum of £600 relief from LBTT per transaction, unlike other relief types which can relieve the entire tax liability of potentially much larger transactions.
In previous years, 'Relief for certain acquisitions of residential property' has been the second most frequently claimed relief. Claims for this relief also fell from around 600 to 1,100 claims per year to fewer than 200 claims in 2020/21. This is also likely to be due to the temporary change to the nil rate threshold. In 2019/20, around 78 per cent of claims for this relief were for transactions with total consideration under £250,000, which would have been liable for nil LBTT from 15 July 2020 to 31 March 2021. This relief includes, for example:
- relief where a house building company buys a home from a person who is buying a new home,
- relief where a property trader buys a home from a person who is buying a new home from a house building company, and
- relief where a property trader buys a home to avoid a chain of transactions breaking down. For further information see the guidance published by Revenue Scotland.
4Under the Coronavirus (Scotland) (No.2) Act 2020, introduced in May 2020, taxpayers who had bought a new main residence before 25 March 2020 (with an effective date for the purchase between 24 September 2018 and 24 March 2020) have 36 months from the effective date of the original transaction to sell their previous main residence before making a claim for repayment of the ADS
5 UK House Price Index: reports - GOV.UK (www.gov.uk)
6 See Registers of Scotland monthly house price statistics: House price statistics - Registers of Scotland (ros.gov.uk)
7 Residential conveyance transactions under £145,000 can incur tax liability if they are linked.
8Provided the taxpayer sells their previous main residence within 18 months of the effective date, they may submit their claim for repayment of ADS up to five years from the filing date. http://www.legislation.gov.uk/asp/2014/16/section/115 However, it is likely that most claims for repayment of ADS will be received shortly after the taxpayer has sold their previous main residence. Taxpayers who paid ADS on transactions with effective date from 25 September 2018 and 24 March 2020 have 36 months to reclaim ADS rather than the usual 18.
9Vigintiles divide data into 20 groups of equal frequency. The vigintiles for each year have been created by ordering the data by descending LBTT declared due. The first vigintile corresponds to the top five per cent of transactions (in terms of LBTT declared due) and so on.
10 The relevant file is dated 18 January 2019 and named ‘LBTT – Sub-Scotland Estimates of Revenues and Transactions.xlsx’.
11 Nomenclature of Territorial Units for Statistics (NUTS) is a standard geographical classification system.
12 The relevant file is dated 11 October 2018 and named ‘LBTT – reliefs.xlsx’
13 ADS revenue forgone to reliefs is distinct from claims for repayment of ADS following the sale of the taxpayer's previous main residence.
14 LBTT3025 - Group relief | Revenue Scotland
15 LBTT3035 - Charities relief | Revenue Scotland