
- Land and Buildings Transaction Tax (LBTT) is a charge on land transactions in Scotland. Land transactions must be notified to Revenue Scotland, unless the chargeable consideration is less than £40,000, or the transaction is otherwise exempt.
- The Additional Dwelling Supplement (ADS) is an additional charge which applies when the taxpayer is purchasing an additional property and not replacing their main residence. ADS most commonly arises for purchases of a second home or a buy-to-let dwelling.
Table 1: Number of LBTT returns received by type of transaction and year
|
Type of transaction |
2015/16 |
2016/17 |
2017/18 |
2018/19 |
2019/20 |
2020/21 |
2021/22 |
|---|---|---|---|---|---|---|---|
|
Residential |
103,680 |
100,500 |
103,930 |
103,750 |
105,110 |
96,900 |
110,180 |
|
Non-residential |
6,220 |
6,810 |
6,880 |
7,160 |
6,440 |
5,940 |
7,050 |
|
Lease |
5,260 |
5,690 |
5,570 |
5,130 |
4,920 |
3,500 |
4,560 |
|
Review of a lease |
|
4,220 |
4,570 |
2,900 |
4,590 |
||
|
All |
115,150 |
113,000 |
116,380 |
120,250 |
121,040 |
109,240 |
126,380 |
The number of LBTT returns received for each type of transaction has been more consistent over time than LBTT declared due. Since 2015, Residential conveyances have made up 88% of LBTT returns. 6% of returns have been non-residential conveyances, and 4% have been for leases. Reviews of a lease have accounted for 3% of returns in the four years since they came into effect in 2018/19.
Non-residential conveyances have made up 29% of LBTT declared, but only 6% of returns since 2016/17. This is because a large proportion of non-residential LBTT declared is usually made up of a small number of high-value transactions.
By contrast, reviews of a lease account for 3% of LBTT returns received, but less than 0.1% of LBTT declared due.
Figure 1: LBTT including ADS declared due, by year and transaction type
2021/22 saw the highest ever LBTT declared due at £827 million. This up 57% on the year before, and is 38% higher than the previous high of £600.6 million recorded in 2019/20. This record-high figure was driven mainly by strong increases in both residential and non-residential LBTT.
Since the introduction of ADS in April 2016, residential LBTT revenue has typically been around double or more than that of non-residential LBTT. This remains true in 2021/22 with residential LBTT being 2.5 times the figure for non-residential LBTT. Before 2016, figures for residential and non-residential were much closer. The current ratio reflects rising house prices, and the fact that ADS mainly applies to residential conveyances.
In 2021/22, residential conveyances accounted for 69% of total LBTT declared due. Non-residential conveyances accounted for 27% and leases were 3%. Reviews of a lease accounted for less than 0.1% of LBTT revenue, which has been the case since their introduction in 2018.
At £827 million, total LBTT revenue in 2021/22 was almost double the figure of £416 million which was recorded in its first year of collection (2015/16).
Residential LBTT excluding ADS
LBTT rates and bands for residential transactions as of 1 April 2021:
| Purchase Price | LBTT rate |
|---|---|
| Up to £145,000 | 0% |
| £145,001 to £250,000 | 2% |
| £250,001 to £325,000 | 5% |
| £325,001 to £750,000 | 10% |
| Over £750,000 | 12% |
Table 2: LBTT declared due, excluding ADS, and number of returns for residential conveyances
|
2017/18 |
2018/19 |
2019/20 |
2020/21 |
2021/22 |
|
|---|---|---|---|---|---|
|
LBTT excluding ADS (£ millions) |
260.2 |
261.0 |
287.1 |
256.4 |
416.5 |
|
LBTT returns received |
103,930 |
103,750 |
105,110 |
96,850 |
110,180 |
|
LBTT excluding ADS per return received1 (£) |
2,500 |
2,500 |
2,700 |
2,600 |
3,800 |
1. Note Rounded to the nearest £100
Residential LBTT declared due, excluding ADS, hit a record high of £416.5 million in 2021/22, which is 45% up from the previous high. This comes after the 11% annual drop which occurred in 2020/21 due to the effects of the COVID-19 pandemic, prior to which revenue from residential conveyances had increased each year on record. The number of residential LBTT returns also hit a record high, with 110,180 submitted.
The average amount of LBTT paid per return for residential conveyances had not varied much in the 4 years prior to 2021/22, with the figure ranging between £2,500 and £2,700. In 2021/22 this figure rose significantly, jumping 46% on the year before to an average of £3,800 paid per return. This rise is driven by an increase in the proportion of conveyances in the higher LBTT bands, which reflects rising property prices.
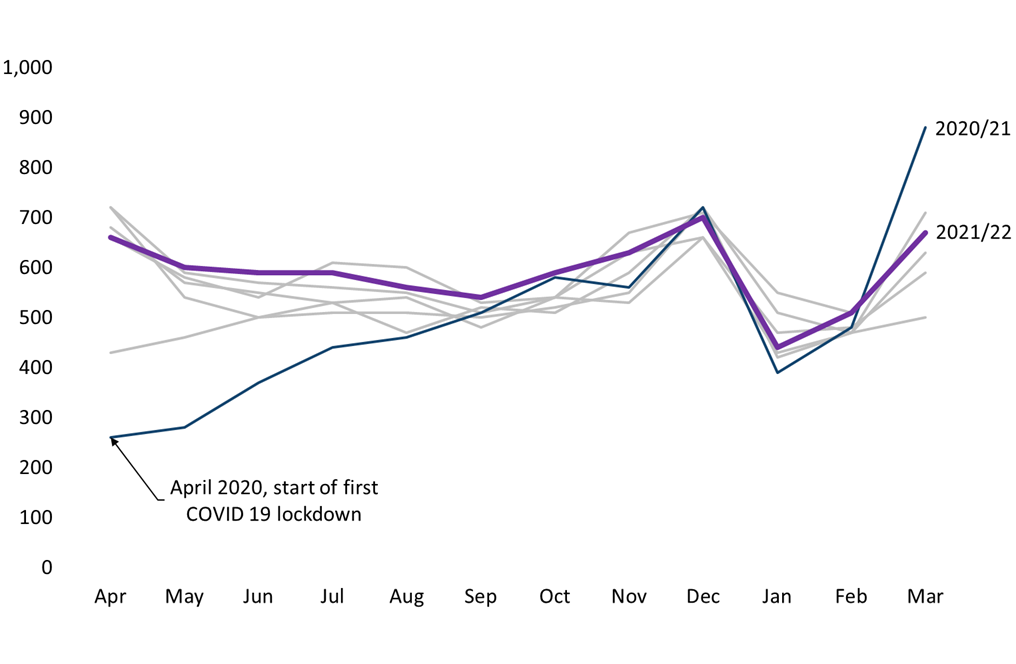
Figure 2: Number of residential conveyance returns received by month
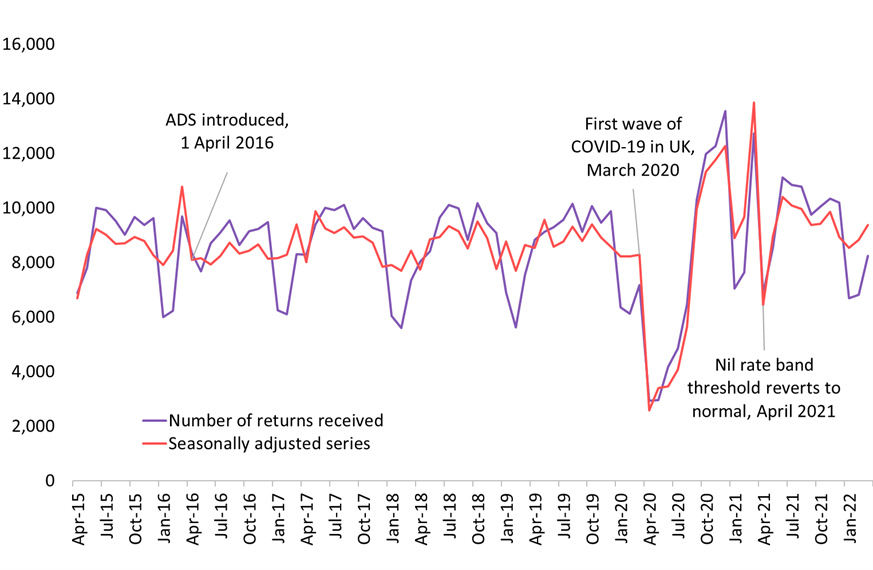
Figure 3: LBTT declared due, excluding ADS, for residential conveyances received by month
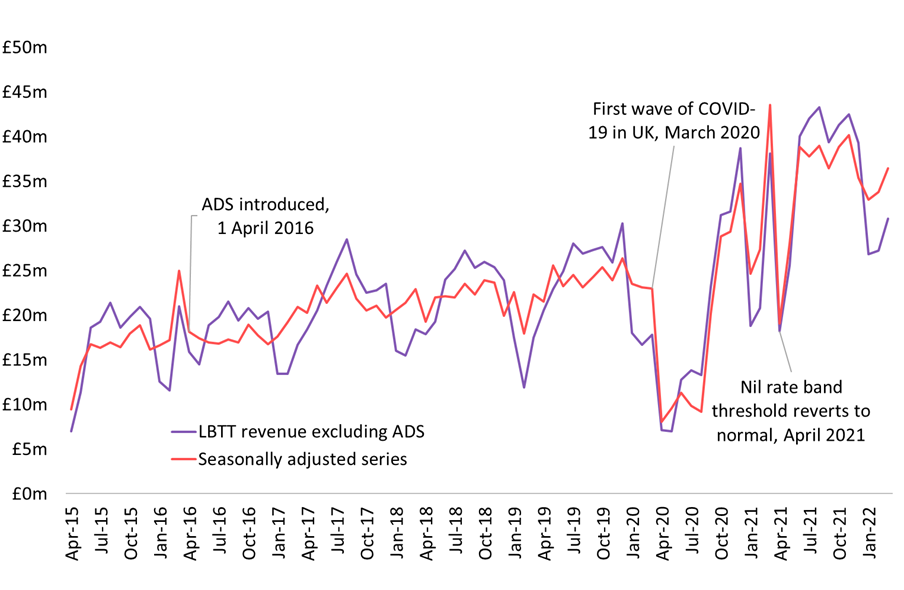
Both the number of residential LBTT returns and the revenue excluding ADS show consistent seasonal, monthly, and weekly patterns. Fewer returns in all of the LBTT bands are received in January and February, and these months are also associated with lower average house prices. This is due in part to the proportion of returns relating to properties in the two highest tax bands being lowest at this time of year.
After accounting1 for the known seasonal and calendar effects, the number of residential LBTT returns received remained relatively constant from 2015/16 to 2019/20. The effects of the COVID-19 pandemic on this trend can be seen from the end of March 2020 with the start of the first lockdown.
Between 15 July 2020 to 31 March 2021 the nil rate band threshold was temporarily increased from £145,000 to £250,000. This likely led to the unusually high number of returns seen in March 2021, and the large drop in April 2021 when the threshold reverted back to £145,000.
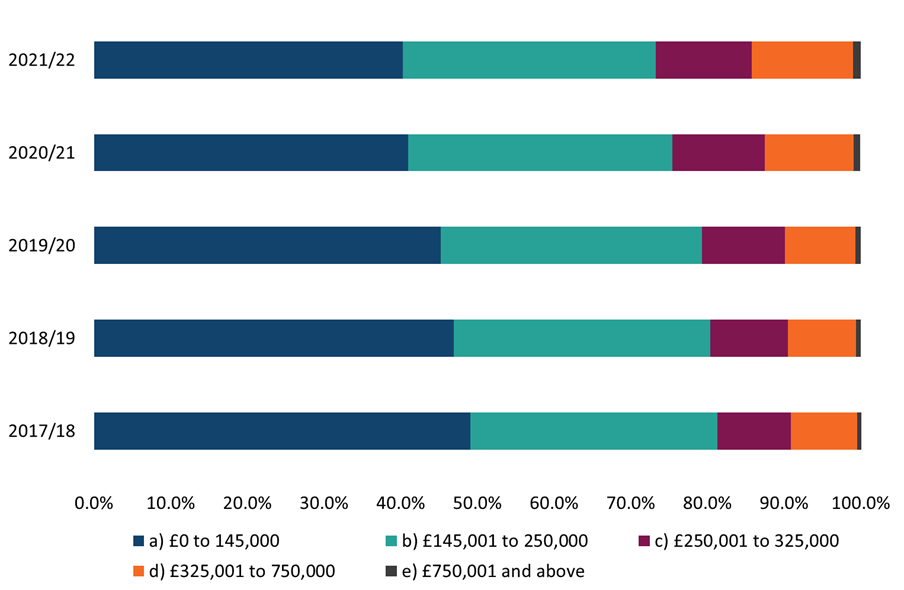
Figure 4: Distribution of residential conveyance returns received by residential LBTT band and year
1. Seasonal adjustment performed using the X13-SEATS-ARIMA procedure, using a weighted count of weekdays in each month as a regression factor to adjust for calendar effects.
Figure 4 shows that there has been an upward shift in the distribution of residential conveyances in each year, i.e. a decreasing proportion of returns in the £0 to £145,000 band each year and increasing proportions of returns received in all higher bands, becoming steeper in 2020/21. This is consistent with the increase in average residential property prices reported by Registers of Scotland year on year from 2016/17 to 2019/20, and a sharper increase in average residential property prices following the initial disruption of COVID-19 in 2020/21.
Figure 4 shows that 40% of returns received in 2021/22 had a total consideration of less than or equal to £145,000 and, therefore, had zero tax liabilities2. However, Figure 5 shows LBTT revenue is dominated by the £325,000 to £750,000 band, which in 2021/22 contributed 58 per cent of LBTT, while making up only 13% of returns. The highest band (£750,001 and above) accounts for 1% of returns received and 23% of tax.
Figure 5: Distribution of residential LBTT revenue, excluding ADS, by residential LBTT band and year
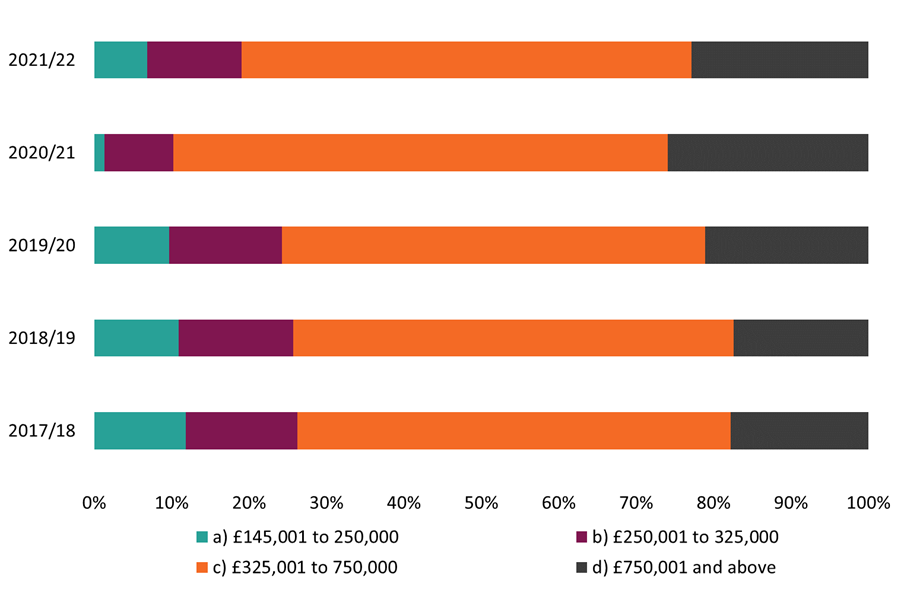
The share of revenue contributed by the top two tax bands increased in 2020/21 due to the temporary change to the nil rate threshold, effective from 15 June 2020 to 31 March 2021, which had the effect of reducing tax liabilities in the second-lowest residential tax band (consideration from £145,000 to £250,000) to zero, and reducing gross tax liabilities for all other residential transactions by £2,100.
2Residential conveyance transactions under £145,000 can incur tax liability if they are linked.
Figure 6: Distribution of numbers of residential conveyance transactions by total consideration and tax band 2021/22 (based on effective date)
Figure 6 shows a more detailed breakdown of the number of residential conveyance transactions by total consideration (e.g. house price) for transactions that took place in 2021/22. The majority of transactions are towards the lower end of the scale (approximately two-thirds are less than or equal to £220k), with the distribution then extending to a long tail of higher value transactions. Due to the smaller numbers of transactions at the higher value end, the width of the total consideration categories is increased at the points indicated on the chart.
Additional Dwelling Supplement
If a taxpayer buys a new main residence before selling their previous main residence, they will have to pay Additional Dwelling Supplement (ADS). This payment can be reclaimed if the previous main residence is sold within 18 months, and the claim is made within five years of the submission date.
In 2021/22, ADS was charged at 4% of the relevant consideration for a transaction where the total purchase price of an additional dwelling was £40,000 or more. Prior to January 25 2019 it had been charged at 3%. On December 16 2022 the rate was raised from 4% to 6%, but this period is not covered by this publication.
Table 3: Gross ADS reclaimed and number of ADS repayments claimed for residential LBTT returns by year
|
Gross ADS declared due (£ millions) |
LBTT returns received with ADS declared due |
|||||
|---|---|---|---|---|---|---|
|
Total |
Reclaimed1 |
Reclaimed1 |
Total |
Reclaimed1 |
Reclaimed1 (%) |
|
|
2017/18 |
122.1 |
31.5 |
25.8% |
23,530 |
4,050 |
17.2% |
|
2018/19 |
128.1 |
35.6 |
27.8% |
23,620 |
4,360 |
18.5% |
|
2019/20 |
163.5 |
44.1 |
27.0% |
23,230 |
4,100 |
17.7% |
|
2020/21 |
153.8 |
43.8 |
28.5% |
20,790 |
3,820 |
18.4% |
|
2021/22 |
188.4 |
31.5 |
16.7% |
25,120 |
2,660 |
10.6% |
1. The data reflects claims for repayment of ADS received up to and including 31 May 2022 and will be revised over time as more claims for repayment of ADS are received. This is primarily for returns received in 2020/21 and 2021/22
Roughly £188 million in gross ADS was declared due in 2021/22, an increase of approximately £35 million (22%) on the previous year. The sharp increase in ADS declared due from 2018/19 to 2019/20 was due largely to the increase in the ADS rate from 3% to 4% in January 2019.
Approximately 25,100 residential LBTT returns received in 2021/22 had ADS declared due, equating to 23% of all residential conveyances received, a similar proportion to previous years (21% in 2020/21).
Around 11% of taxpayers who submitted LBTT returns with ADS declared due in 2021/22 have since claimed repayment of ADS, accounting for 17% of the gross ADS declared due.
The ADS reclaim rate for 2021/22 appears lower than previous years. However, this figure will continue to increase over time as more claims for repayment are made. Only minimal revisions are expected to repayment claims relating to returns made up to 2019/20.
During the coronavirus pandemic in 2020, legislation was introduced to extend the ADS repayment claim period for residential transactions which were still within their original ADS repayment claim period at the start of the restrictions, from 18 months to 36 months. This means that some returns relating to 2018/19 and 2019/20 may still be eligible for ADS repayment claims in 2021/22 and 2022/23. However, the majority of repayment claims are still expected to have been made within one year
Figure 7: Proportion of gross ADS declared due subsequently reclaimed and LBTT returns received with ADS declared due and a subsequent claim for repayment, by month for residential conveyances
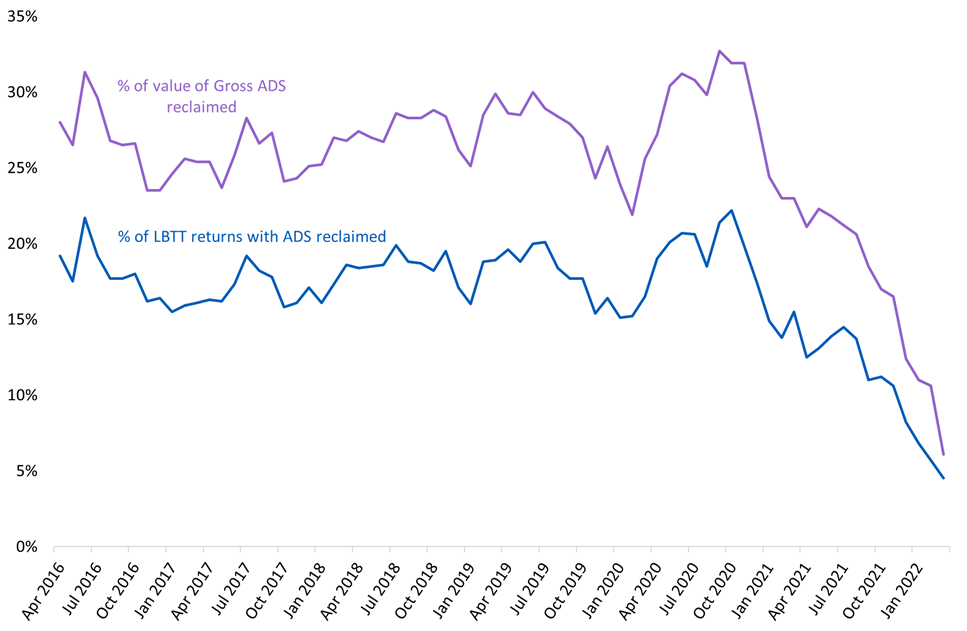
The gross ADS reclaimed rises from 6% for the most recent month (% of ADS declared due in March 2022 which was reclaimed by end May 2022) to around 27% for the first 56 months (April 2016 to November 2020). This is a reflection of the fact that ADS taxpayers from earlier months have had 18 months from the effective date3 of the transaction subject to ADS to sell their previous main residence and then reclaim ADS. Similarly, the number of claims for repayment of ADS rises from 5% for the March 2022 to around 18% for April 2016 to November 2020.
3 Provided the taxpayer sells their previous main residence within 18 months of the effective date, they may submit their claim for repayment of ADS up to five years from the submission date.
Though taxpayers have 18 months from the effective date of the transaction to sell their previous main residence and reclaim ADS, the majority of claims for repayment are received much sooner
Table 4: Proportion of ADS reclaimed and reclaims received by time between submission of LBTT return and claim for repayment
|
Weeks from return submission to repayment claim |
Gross ADS reclaimed |
Claims received |
|---|---|---|
|
< 4 |
9.3% |
8.7% |
|
< 8 |
14.4% |
13.9% |
|
< 12 |
11.9% |
11.6% |
|
< 16 |
9.6% |
9.7% |
|
< 20 |
7.9% |
8.3% |
|
< 24 |
6.2% |
6.3% |
|
< 28 |
5.3% |
5.4% |
|
< 32 |
4.6% |
4.6% |
|
< 36 |
3.8% |
3.8% |
|
< 40 |
3.3% |
3.3% |
|
< 44 |
3.1% |
3.2% |
|
< 48 |
2.7% |
2.8% |
|
< 52 |
2.6% |
2.6% |
|
< 56 |
2.1% |
2.1% |
|
< 60 |
1.6% |
1.6% |
|
< 64 |
1.6% |
1.7% |
|
< 68 |
1.4% |
1.5% |
|
< 72 |
1.6% |
1.7% |
|
< 76 |
1.9% |
1.9% |
|
< 80 |
1.7% |
1.7% |
|
80 or more |
3.4% |
3.3% |
Notes:
1. The data reflects claims for repayment of ADS received up to and including 31 May 2022 and will be revised over time as more claims for repayment of ADS are received, primarily for returns received in 2020/21 and 2021/22. In May 2020, the period for reclaiming ADS was extended for buyers who bought a new main residence effective between 24 September 2018 and 25 March 2020. Revisions relating to 2019/20 can be expected in 2021/22 and 2022/23.
Approximately 9% of claims are received within four weeks, over half of all claims are received within 20 weeks and approximately 84% of all claims are received within a year. The percentages are very similar for gross ADS reclaimed, as claims received and gross ADS reclaimed follow a near identical distribution.
Table 5: Number of LBTT returns received with ADS declared due and the proportion with a subsequent claim for repayment, by year and stated intention to reclaim
|
LBTT returns received with ADS declared due |
Proportion with a subsequent claim for repayment |
|||||
|---|---|---|---|---|---|---|
|
Yes, intend to reclaim ADS |
No intention to reclaim ADS |
Total |
Yes, intend to reclaim ADS |
No intention to reclaim ADS |
All |
|
|
2017/18 |
5,950 |
17,580 |
23,530 |
64.0% |
1.4% |
17.2% |
|
2018/19 |
5,830 |
17,790 |
23,620 |
67.9% |
2.3% |
18.5% |
|
2019/20 |
4,870 |
18,360 |
23,230 |
70.4% |
4.5% |
18.3% |
|
2020/21 |
4,240 |
16,550 |
20,790 |
72.6% |
4.5% |
18.4% |
|
2021/22 |
4,090 |
21,030 |
25,120 |
54.3% |
2.1% |
10.6 |
Notes: The data reflects claims for repayment of ADS received up to and including 31 May 2022 and will be revised over time as more claims for repayment of ADS are received, primarily for returns received in 2020/21 and 2021/22.
For LBTT returns submitted with ADS declared due in 2021/22, around 84% of taxpayers stated they did not intend to reclaim ADS. This is the highest percentage on record, up from 80% in 2020/21 and 79% in 2019/20. One potential reason for this might be that improvements have been made to the ADS reclaiming guidance which outlined the rules around reclaims, and therefore helped to reduce the number of cases where the intention to reclaim ADS had been stated erroneously when the case did not qualify for a reclaim.
In 2020/21 around 73% of taxpayers who stated that they intended to reclaim ADS went on to do so, the highest proportion so far. in 2017/18, less than 2% of taxpayers who stated they did not intend to reclaim ADS went on to do so. This figure increased to 4.5% for both 2019/20 and 2020/21, and was 2.1% in 2021/22 for reclaims made by 31 May 2022.
These figures indicate that a substantial proportion (around 27% at its lowest in 2020/21) of taxpayers who stated that they intended to reclaim ADS did not subsequently do so. However, when a taxpayer had stated that they did not intend to reclaim ADS then it was unlikely that they would submit a claim for repayment
Figure 8: Distribution of residential conveyances by type of transaction (ADS declared due and intends/does not intend to reclaim ADS) and residential LBTT band, 2016/17 to 2021/22
Figure 8 shows that the proportion of conveyances in the lowest tax band is twice as high for returns where the taxpayer does not intend to reclaim ADS, compared to returns where they do intend to reclaim. This likely reflects the fact that these transactions will include buy-to-let properties and second homes. Higher value transactions make up a much higher proportion of returns where the taxpayer intends to reclaim ADS. This is likely to reflect a number of factors including the fact that these transactions will include taxpayers who may be moving up the property ladder as they intend to replace their previous main residence.
Non-residential conveyances
Non-residential rates and bands for transactions on or after 25 January 2019:
| Purchase price | LBTT rate |
|---|---|
| Up to £150,000 | 0% |
| £150,001 to £250,000 | 1% |
| Above £250,000 | 5% |
Table 6: Non-residential LBTT declared due and number of returns received by year
|
2017/18 |
2018/19 |
2019/20 |
2020/21 |
2021/22 |
|
|---|---|---|---|---|---|
|
LBTT declared due (£ millions) |
178.1 |
168.8 |
173.1 |
125.3 |
227.5 |
|
Annual percentage change in LBTT declared due |
15.0% |
-5.2% |
2.5% |
-27.6% |
81.6% |
|
LBTT returns received |
6,880 |
7,160 |
6,440 |
5,930 |
7,050 |
|
Annual percentage change in LBTT returns received |
1.0% |
4.0% |
-10.0% |
-7.8% |
18.9% |
|
LBTT declared due per return received1 (£) |
25,900 |
23,600 |
26,900 |
21,100 |
32,300 |
Note 1.Rounded to the nearest £100
LBTT from non-residential conveyances, including ADS, hit a record high of £228 million in 2021/22, an increase of £102 million (82%) on the previous year, while the number of LBTT returns received increased by 19%. Both figures are likely to reflect a build-up in demand from the previous year, which was impacted by the effects of the COVID-19 pandemic.
Despite only making up 6% of LBTT returns received, non-residential conveyances accounted for approximately 28% of total LBTT declared due in 2021/22. The average LBTT declared due per return also increased sharply in 2021/22, rising 53% on the previous year to £32,300. This likely reflects a number of factors including rising property prices and a higher proportion of very high value transactions.
Compared to residential LBTT, the value of LBTT from non-residential conveyances is highly volatile due to fluctuations in the small number of very high value transactions seen in each year.
Figure 9: Number of non-residential LBTT returns received by month and year
The distribution of non-residential LBTT returns received throughout the year is typically uniform from month to month, but with notable peaks at the end of both the calendar year and financial year. 2021/22 marked a return to this pattern of returns received following the outlier in 2020/21. Due to the effects of the COVID-19 pandemic, the financial year began with an all-time low for non-residential returns in April 2020 and gradually recovered until a final sharp peak in March 2021.
Table 7: LBTT declared due by month and year for non-residential conveyances
|
LBTT declared due (£ millions) |
|||||
|---|---|---|---|---|---|
|
Month |
2017/18 |
2018/19 |
2019/20 |
2020/21 |
2021/22 |
|
Apr |
17.1 |
12.7 |
13.7 |
2.7 |
12.0 |
|
May |
11.1 |
12.1 |
13.1 |
6.4 |
13.0 |
|
Jun |
10.1 |
19.9 |
13.7 |
5.6 |
22.8 |
|
Jul |
9.1 |
13.5 |
19.8 |
11.7 |
17.5 |
|
Aug |
10.3 |
17.3 |
15.5 |
9.8 |
19.6 |
|
Sep |
12.9 |
9.2 |
14.6 |
10.1 |
13.1 |
|
Oct |
14.4 |
10.7 |
13.7 |
14.9 |
20.2 |
|
Nov |
24.6 |
15.7 |
8.8 |
12.5 |
16.0 |
|
Dec |
23.3 |
18.0 |
17.3 |
20.3 |
32.2 |
|
Jan |
18.4 |
13.9 |
17.9 |
8.5 |
17.6 |
|
Feb |
11.3 |
10.1 |
15.7 |
9.1 |
22.0 |
|
Mar |
15.5 |
15.5 |
9.3 |
13.7 |
21.4 |
Non-residential LBTT declared due is more variable than the number of LBTT returns received because a small number of high-value transactions can have a significant impact on the overall tax. There is typically a peak in December, though the magnitude varies from year to year. 2021/22 showed a very strong December peak, doubling the figure from the previous month. There was also a smaller peak in June, which rose 75% on the month before.
Figure 10 shows that the most valuable 5% of non-residential LBTT returns tend to account for the vast majority of LBTT due. In 2021/22 the top 5% most valuable transactions made up 75% of non-residential LBTT due. Total non-residential LBTT is generally highly dependent on higher value transactions, with 97% of LBTT coming from the top 20% most valuable non–residential transactions in 2021/22. In fact, the entire lower half of non-residential LBTT returns ranked by value, accounted for less than 0.05% of the total non-residential LBTT declared due.
LBTT declared due for the top 5% most valuable non-residential transactions varies from year to year, with these variations accounting for the majority of the change in non-residential LBTT declared due. LBTT declared due for the top 5% of transactions increased by 87% in 2021/22 compared to the previous year, which was heavily impacted by the COVID-19 pandemic, corresponding to an 81% increase in total non-residential LBTT . Compared to 2019/20, LBTT for the top 5% of transactions was 32% higher in 2021/22, and total non-residential LBTT was up by 31%.
Leases
A non-residential lease that is granted, or is treated as having been granted, for the first time on or after 1 April 2015 is potentially chargeable to Land and Building Transactions Tax.
99% of leases are non-residential, but analysis in this section includes a small number of leases which taxpayers have classified as residential, perhaps mistakenly. However, the overall tax position remains correct as the LBTT due for a lease is the same whether it is residential or non-residential.
Table 8: LBTT declared due and number of LBTT returns received by year for leases
|
2017/18 |
2018/19 |
2019/20 |
2020/21 |
2021/22 |
|
|---|---|---|---|---|---|
|
LBTT declared due (£ millions) |
25.2 |
29.4 |
20.4 |
18.5 |
25.8 |
|
Annual percentage change |
14.8% |
16.8% |
-30.5% |
-9.2% |
39.7% |
|
LBTT returns received |
5,570 |
5,130 |
4,920 |
3,500 |
4,560 |
|
Annual percentage change |
-2.1% |
-7.9% |
-4.1% |
-28.9% |
30.3% |
|
LBTT declared due per return received, nearest hundred (£) |
4,500 |
5,700 |
4,100 |
5,300 |
5,700 |
£26 million in LBTT was declared due for leases in 2021/22, accounting for 3% of total LBTT declared. This was an increase of £7 million (40%) from 2020/21, while the number of lease returns received increased by 30%. LBTT from leases tends to have high variance from year to year, but the sharp increase in 2021/22 is due in part to a recovery from 2020/21 which was affected by the COVID-19 pandemic.
Like non-residential returns, the number of lease returns received tends to be highest towards the ends of the financial and calendar years. Unlike conveyances, of which generally fewer returns are received in January and February, there is no obvious low season for leases.
LBTT declared due for leases shows similar high variability to non-residential conveyances and a small number of high value transactions can have a significant impact on the overall tax
Figure 11: LBTT declared due for top 5% of lease transactions, by year
In the last five years, revenue from the top 5% most valuable lease transactions has accounted annually for 63% to 74% of total LBTT from leases. In 2021/22 the top 5% of transactions made up 70% of LBTT from leases. Like non-residential conveyances, the distribution of LBTT from leases in general is heavily skewed towards the most valuable transactions, with 91% of total lease LBTT coming from the top 20% of transactions.
LBTT for leases may be due on the net present value of rent, as well as payment of a premium to secure the lease. 87% of all LBTT declared due on leases in 2021/22 was due to rent, with the remaining 13% due to premiums. LBTT due on premiums is dominated by a small number of large premiums over £350,000. LBTT due on the rental value of leases is more widespread, with 59% of lease returns declaring some amount of LBTT due on rent in 2021/22.
Reviews of the tax chargeable for a lease
Reviews of a lease include:
- Three-yearly reviews, which inform Revenue Scotland of any changes which have occurred since the effective date or previous review date. Tax chargeable on the lease is reviewed and the new Net Present Value is calculated when the review is submitted.
- Assignations: when a lease is assigned to a new tenant, the outgoing tenant must submit a review within 30 days of the lease being signed, including an assessment of the amount of tax chargeable reflecting any changes since the last return was submitted.
- Terminations: When a lease is terminated, the tenant at the point of termination must submit a return to Revenue Scotland, including an assessment of the amount of tax chargeable reflecting any changes since the last return was submitted.
The first six-year reviews became due from 1 April 2021 and make up part of the three-year review figures for this year.
Table 9: LBTT declared due and number of returns received for reviews of a lease by type of review and the amount due
|
Type of review |
Change |
LBTT declared due (£ millions) |
Reviews received |
||||||
|
2018/19 |
2019/20 |
2020/21 |
2021/22 |
2018/19 |
2019/20 |
2020/21 |
2021/22 |
||
|
Assignation |
Increase |
0.0 |
0.0 |
0.3 |
0.1 |
20 |
60 |
60 |
70 |
|
No change |
0.0 |
0.0 |
0.0 |
0.0 |
200 |
240 |
220 |
200 |
|
|
Decrease |
0.0 |
-0.1 |
-0.1 |
-0.1 |
0 |
30 |
40 |
40 |
|
|
All |
0.0 |
0.0 |
0.2 |
0.0 |
220 |
330 |
320 |
310 |
|
|
Termination |
Increase |
0.0 |
0.0 |
0.0 |
0.1 |
20 |
30 |
20 |
50 |
|
No change |
0.0 |
0.0 |
0.0 |
0.0 |
230 |
280 |
180 |
220 |
|
|
Decrease |
-0.3 |
-0.5 |
-0.6 |
-0.7 |
60 |
110 |
110 |
180 |
|
|
All |
-0.2 |
-0.4 |
-0.5 |
-0.7 |
320 |
420 |
310 |
450 |
|
|
Three-year lease review |
Increase |
1.0 |
1.3 |
0.5 |
1.8 |
410 |
540 |
370 |
790 |
|
No change |
0.0 |
0.0 |
0.0 |
0.0 |
3,020 |
3,070 |
1,730 |
2,670 |
|
|
Decrease |
-0.8 |
-0.2 |
-0.2 |
-0.6 |
250 |
220 |
170 |
380 |
|
|
All |
0.2 |
1.0 |
0.3 |
1.2 |
3,680 |
3,830 |
2,270 |
3,840 |
|
|
All |
Increase |
1.0 |
1.3 |
0.9 |
1.9 |
450 |
630 |
440 |
910 |
|
No change |
0.0 |
0.0 |
0.0 |
0.0 |
3,460 |
3,580 |
2,130 |
3,080 |
|
|
Decrease |
-1.0 |
-0.8 |
-0.8 |
-1.4 |
310 |
350 |
320 |
600 |
|
|
All |
0.0 |
0.6 |
0.0 |
0.6 |
4,220 |
4,570 |
2,900 |
4,590 |
|
Review returns which declare a decrease in the amount due from the original lease return, reflect claims for repayment. Three-yearly lease reviews resulted in net LBTT declared due of £1.2 million in 2021/22, consisting of £1.8 million in further LBTT due and £0.6 million of repayments claimed. Lease assignations netted approximately zero LBTT in 2021/22 after repayments. Lease terminations resulted in a net repayment of £0.7 million, bringing the overall net LBTT declared due for all lease reviews to £0.6 million.
Approximately 4,590 reviews of a lease were received in 2021/22, of which 67% declared no change in the LBTT due from the original lease return (meaning LBTT declared due on review was £0). 20% declared further LBTT due and 13% claimed a repayment of LBTT.
Three-yearly lease reviews accounted for 84% of reviews of a lease received. The total number of lease reviews received was 58% higher than the previous year, driven primarily by a 69% rise in the number of three-yearly lease reviews.
Sub-Scotland
Sub-Scotland: Residential LBTT
Figure 12: Estimates of LBTT declared due, excluding ADS, for residential conveyances by local authority (£Millions)
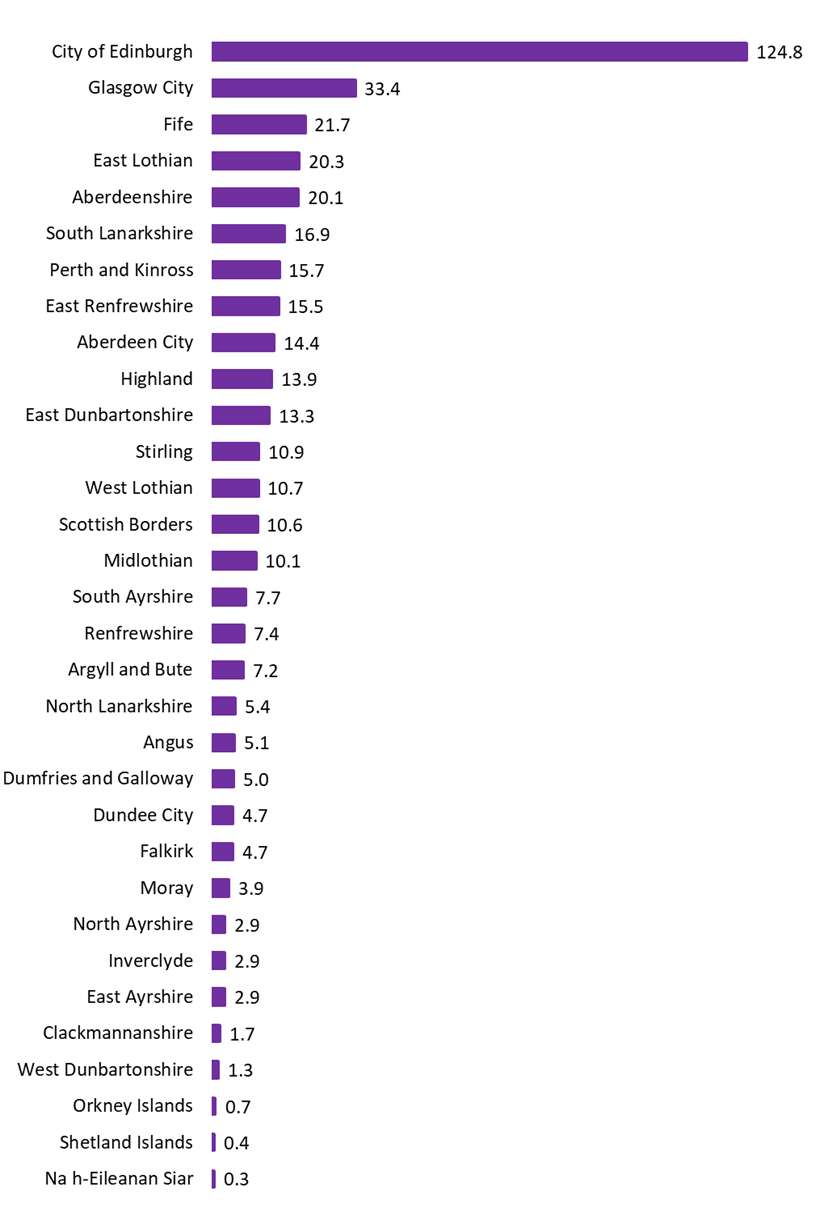
In 2021/22, City of Edinburgh accounted for £125 million (30%) of residential LBTT declared due, excluding ADS, by far the biggest contribution from a single council area. Next highest was Glasgow City, making up 8% of total residential LBTT at £33 million. City of Edinburgh has accounted for 30% to 34% of LBTT revenue, excluding ADS, in each of the last seven years. No other local authority has ever accounted for more than 9%.
The 3 local authorities with the highest mean LBTT declared due per transaction for residential returns were:
- City of Edinburgh at £10,000
- East Lothian at £8,900 and
- East Renfrewshire at £8,400.
The lowest averages were for:
- Na h-Eilianan Siar at around £800
- West Dunbartonshire at £900 and
- North Lanarkshire at £1,000.
From 2020/21 to 2021/22, LBTT revenues increased in all 32 local authorities. City of Edinburgh saw the largest absolute increase with a rise of £39 million (46%), while the largest percentage increase occurred in Orkney Islands where residential LBTT was up 206% (from £0.2 million to £0.7 million). The lowest percentage increase on the previous year was in Clackmannanshire, which saw 32% more residential LBTT declared than in 2020/21. Note that Clackmannanshire and Orkney Islands have relatively small numbers of transactions, so are more likely to vary year to year in terms of percentage change.
Figure 13: Estimated number of residential conveyance returns received by local authority
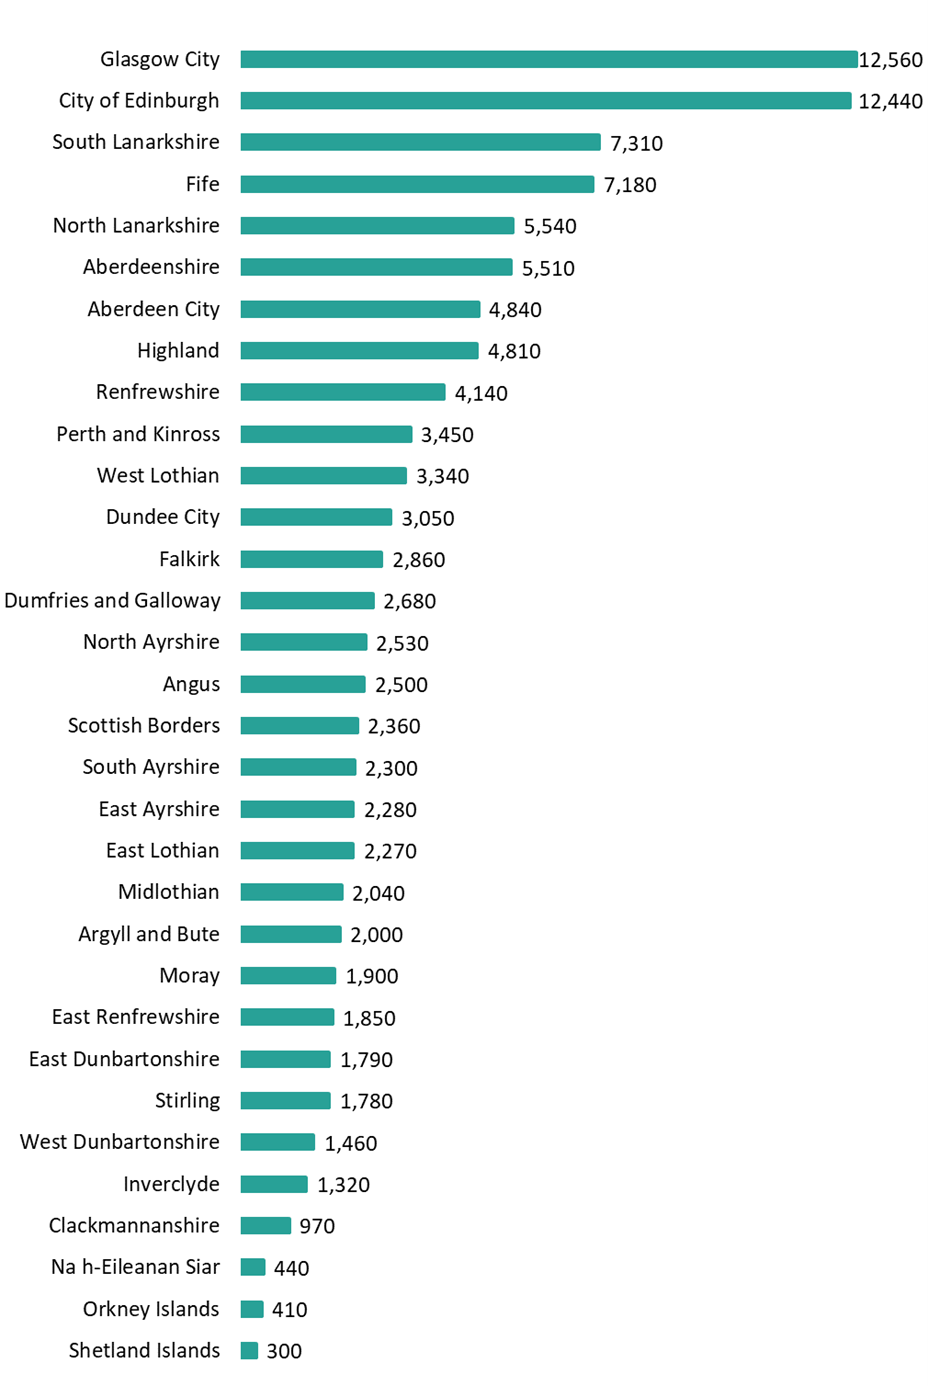
Glasgow City had the most residential conveyance returns received in 2021/22 with 12,560 returns (11% of the total), just ahead of City of Edinburgh with 12,440 returns (11%).
Numbers of residential conveyances increased in 30 of 32 local authorities from 2020/21 to 2021/22, with City of Edinburgh showing the largest absolute increase of 2,010 more than the previous year.
The council areas with the biggest percentage increase in the number of returns on the previous year were:
- Na h-Eileanan Siar with an increase of 38%
- Aberdeen City with an increase of 33%
- Aberdeenshire with an increase of 28%.
The council areas with the lowest increase, or a decrease, on the previous year were:
- East Dunbartonshire with a decrease of 5%
- East Lothian with a decrease of 3%
- West Lothian, which increased by only 1%.
Sub Scotland: Additional Dwelling Supplement
Figure 14: Estimates of gross residential ADS declared due (£Millions) by local authority and percentage which is intended to be reclaimed by taxpayer
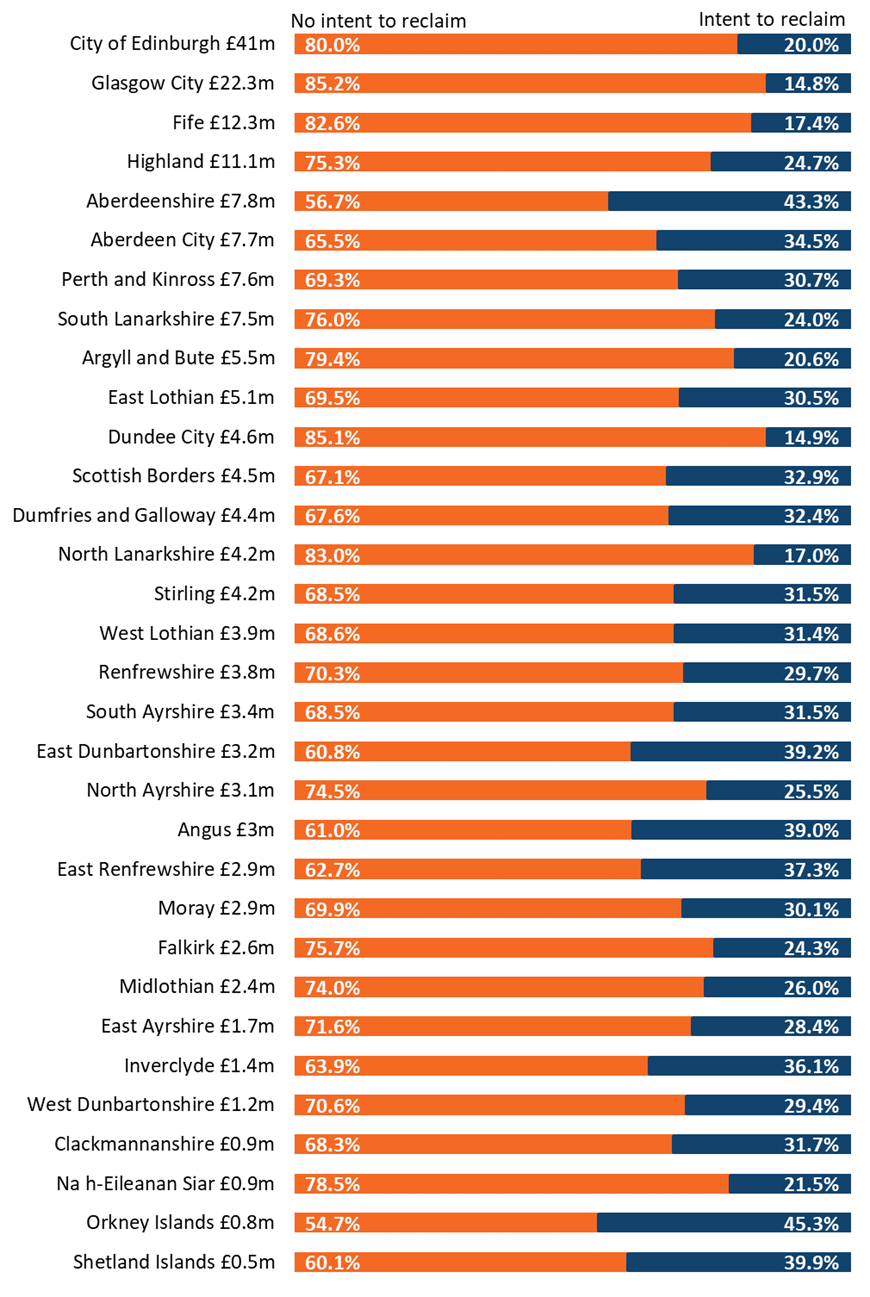
City of Edinburgh accounted for 22% of gross ADS declared due in 2021/22 with £41 million, an increase of £9 million on the previous year. Glasgow City accounted for the second-largest share of ADS, making up 12% of the total with £22 million. Edinburgh tends to dominate LBTT excluding ADS (30% of total) more than gross ADS. This is because the ADS rate is flat whereas the LBTT rate is progressive, meaning the effective tax rate increases with total consideration.
The council areas with the highest proportion of gross ADS coming from taxpayers who don’t intend to reclaim it were Glasgow City and Dundee City at 85% . This figure was lowest in Orkney Islands at 55%.
The council areas with the greatest number of returns with ADS declared due were:
- Glasgow City with 3,350
- City of Edinburgh with 3,230
- Fife with 1,600.
At 92%, Glasgow City also had the highest proportion of returns where the stated intention was to not reclaim ADS. The lowest figure was for Orkney Islands, where 65% of returns stated no intention to reclaim ADS.
Sub-Scotland: Residential conveyances not replacing a main residence
Figure 15: Estimates of the percentage (%) of all residential conveyance returns received where the taxpayer did not intend to reclaim ADS declared due, by local authority and year
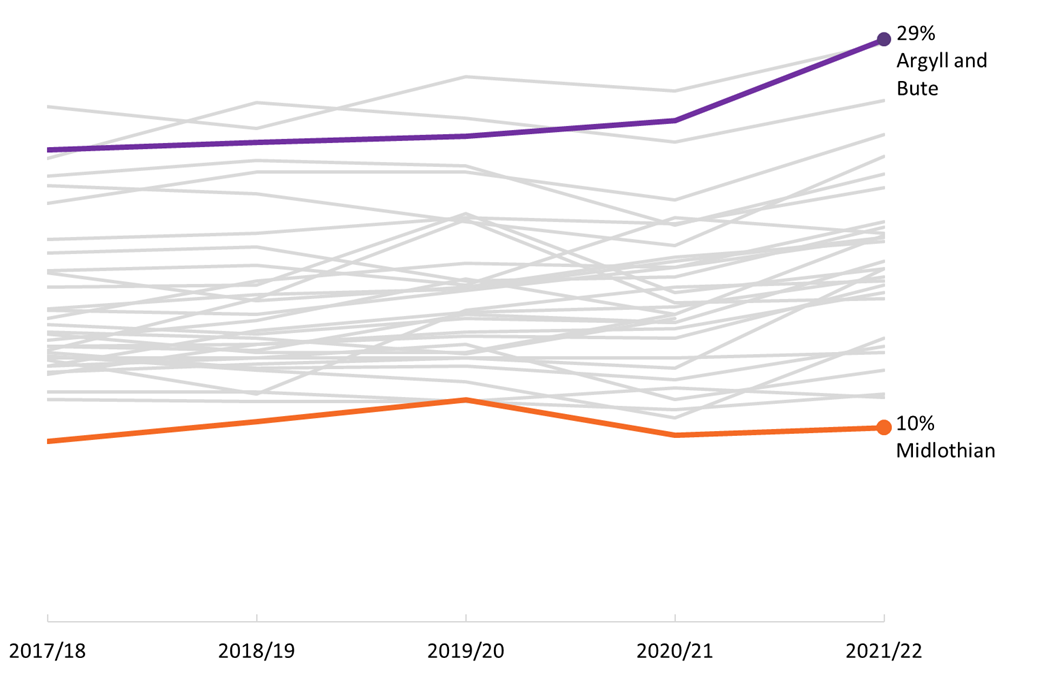
The data shown in Figure 15 is an indicative measure of the percentage of all residential conveyances where the taxpayer is purchasing an additional property (e.g. buy-to-let dwelling or a second home) rather than replacing their main residence. In 2021/22 this was highest in Argyll and Bute at 29.4% (rounded to 29% in figure 15) and Na h-Eileanan Siar at 29.2%.
The lowest figure was in Midlothian, where only 10% of residential LBTT returns declared ADS due, which the taxpayer did not intend to reclaim. Midlothian has been lowest in four of the past five years.
For the council areas with the highest numbers of residential returns, the figures were:
- Glasgow City: 25%
- City of Edinburgh: 23%
- South Lanarkshire: 17%
Sub-Scotland: Residential tax bands
Figure 16: Distributions of residential LBTT returns by local authority and tax band, 2021/22
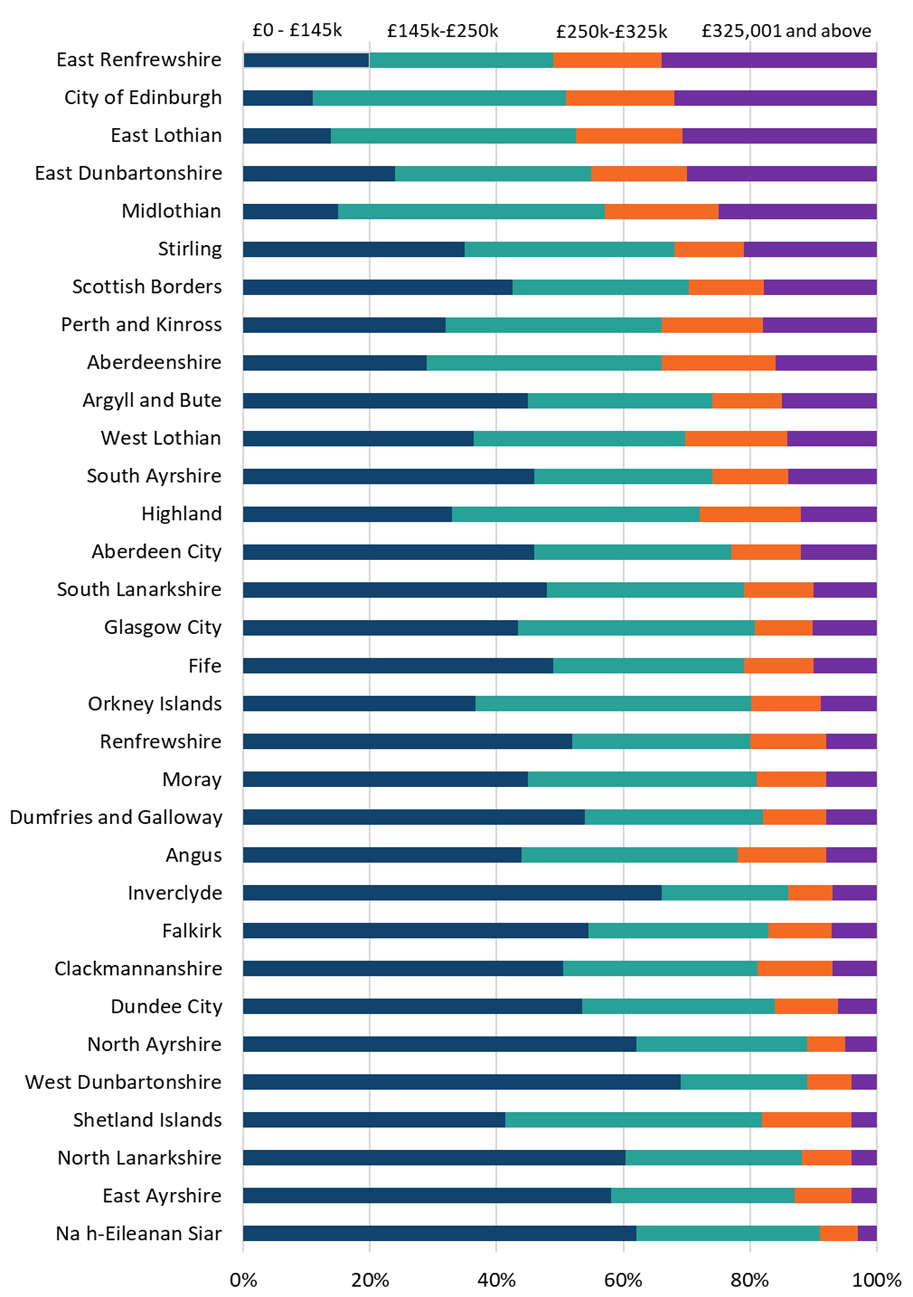
Figure 16 shows the distribution of residential transactions by tax band, with the top two bands (£325,000 to £750,000 and £750,000 and above) combined to protect taxpayer confidentiality.
The council areas with the highest proportion of returns in the top grouped (£325k +) band were:
- East Renfrewshire at 34%
- City of Edinburgh at 32%
- East Lothian at 31%
One in 25 residential returns in City of Edinburgh fell into the highest underlying tax band (£750k+). These 550 returns accounted for nearly half of the 1,140 total returns within the £750k+ tax band in Scotland. East Renfrewshire was the only local authority where fewer than half of transactions were in the bottom two tax bands (49%).
West Dunbartonshire had the highest proportion (69%) of transactions in the nil rate tax band (£0-145k). For 11 of the 32 local authorities, more than half of transactions fell into the nil-rate tax band.
Sub-Scotland: Non-residential conveyances
Sub-Scotland LBTT data is analysed by NUTS 2 areas instead of local authorities for non residential returns, to minimise the risk of disclosing protected taxpayer information.
NUTS stands for Nomenclature of Units for Territorial Statistics, these units were originally devised for the purpose of collecting, developing and harmonising European regional statistics.
Scotland is divided into five of these units, mainly by grouping together Council Areas. These five areas are: Highlands and Islands, North Eastern Scotland, Eastern Scotland, West Central Scotland, and Southern Scotland.
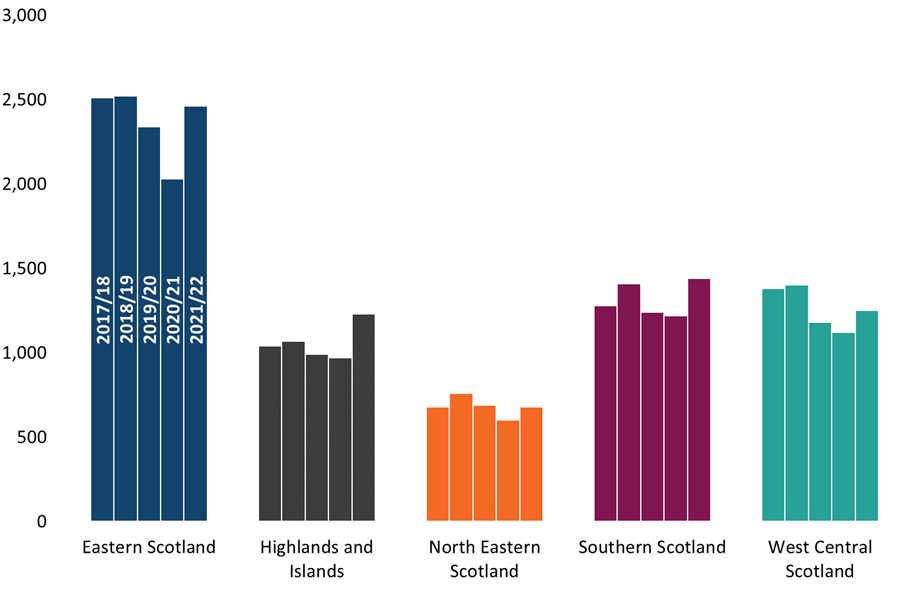
Figure 17: Estimates of non-residential LBTT declared due by NUTS 2 area and year
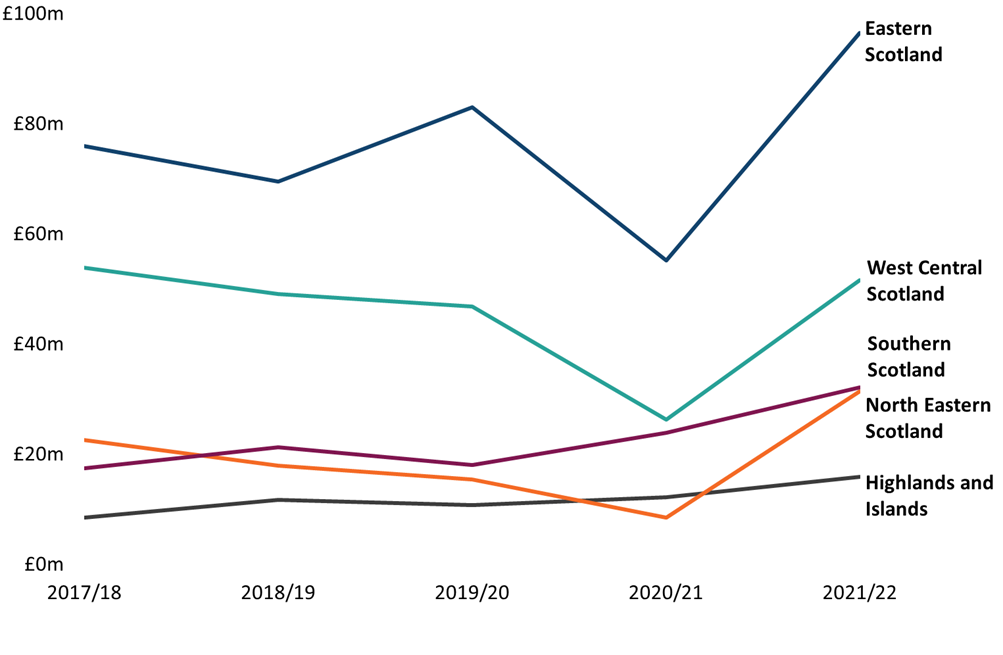
Eastern Scotland consistently makes up the largest share of non-residential LBTT declared due, accounting for £97 million (42%) in 2021/22. The highest number of returns also comes from Eastern Scotland at 2,460 (35%).
All NUTS 2 areas saw an increase in the number of non-residential returns and LBTT due in 2021/22 compared with the previous year. Eastern Scotland, West Central Scotland and North Eastern Scotland all saw significant increases in LBTT due following a dip in 2020/21 due to the impact of COVID 19. Southern Scotland and Highlands and Islands saw more gradual increases and did not experience the dip in 2020/21.
North Eastern Scotland saw a 13% increase in the number of returns in 2021/22 while LBTT due increased by 269%. This reflects the fact that for non-residential LBTT, a small number of very high value transactions can greatly affect the total LBTT due. For this reason, care should be taken when interpreting annual trends in non-residential LBTT by NUTS 2 area.
Figure 18: Estimated number of non-residential returns by NUTS 2 area and year
Reliefs
There are a number of tax reliefs which provide whole or partial relief from LBTT. Common reliefs include:
- First-Time Buyer relief, which currently relieves LBTT on the first £175,000 of the consideration payable for first time buyers, subject to conditions.
- Charities relief, where the buyer in a land transaction is a charity and certain conditions are met.
- Group relief, where at the effective date of a land transaction the seller and buyer are both companies in the same group.
Table 10: Estimated LBTT revenue forgone to reliefs and number of LBTT returns received in which some LBTT revenue has been forgone to reliefs, by year
|
Year |
LBTT forgone (£ millions) |
LBTT returns received in which some LBTT revenue has been forgone to reliefs |
|||||
|
LBTT excluding ADS |
ADS1 |
All |
LBTT excluding ADS |
ADS1 |
All2 |
||
|
2017/18 |
86.6 |
6.2 |
92.8 |
1,950 |
250 |
2,020 |
|
|
2018/19 |
122.4 |
4.3 |
126.7 |
9,940 |
310 |
10,020 |
|
|
2019/20 |
106.2 |
5.7 |
111.9 |
15,390 |
410 |
15,530 |
|
|
2020/21 |
100.8 |
3.6 |
104.4 |
3,020 |
240 |
3,030 |
|
|
2021/22 |
125.5 |
5.2 |
130.7 |
17,660 |
320 |
17,700 |
|
Notes: 1. ADS revenue forgone to reliefs is distinct from claims for repayment of ADS following the sale of the taxpayer's previous main residence.
2. An LBTT return may have LBTT excluding ADS and ADS revenue forgone to reliefs if both are due and relief is claimed. This column counts LBTT returns where LBTT excluding ADS or ADS revenue has been forgone to reliefs and, therefore, will not equal the sum of the previous two columns.
It is estimated that £131 million of LBTT revenue was forgone to reliefs in 2021/22, which represents a £26 million (25%) increase on the previous year. In the same period, total LBTT declared increased 57% and the total number of returns received was up 16%. The number of returns received where some LBTT was foregone to reliefs increased nearly six-fold.
First-time buyer relief was introduced in 2018, and largely accounts for the sharp increase in the number of returns with LBTT foregone to relief in 2018/19 and 2019/20. The steep decline in 2020/21 can be mostly attributed to the temporary increase in the nil-rate tax band. During this period, a large number of transactions which normally would have qualified for first time buyers relief, simply had no LBTT due, making the relief temporarily redundant.
ADS revenue forgone to reliefs is estimated to have accounted for 4% of LBTT revenue forgone to reliefs in the last 5 years.
Table 11: Estimated LBTT revenue forgone to reliefs and number of LBTT returns received in which some LBTT revenue has been forgone to reliefs by type of property and year
|
Year |
LBTT forgone (£ millions) |
Number of LBTT returns in which some LBTT revenue has been forgone to reliefs |
|||||
|
Residential |
Non-residential |
All |
Residential |
Non-residential |
All |
||
|
2017/18 |
12.2 |
80.6 |
92.8 |
1,190 |
840 |
2,020 |
|
|
2018/19 |
15.9 |
110.8 |
126.7 |
9,180 |
840 |
10,020 |
|
|
2019/20 |
17.3 |
94.6 |
111.9 |
14,740 |
790 |
15,530 |
|
|
2020/21 |
16.2 |
88.2 |
104.4 |
2,310 |
730 |
3,030 |
|
|
2021/22 |
35.7 |
95.0 |
130.7 |
16,960 |
740 |
17,700 |
|
Residential returns made up 96% of returns in which some LBTT was forgone to reliefs in 2021/22. However, non-residential returns made up the majority of the total value of LBTT forgone to reliefs (73%). The proportion of the total value of LBTT forgone to reliefs which was attributable to residential reliefs was larger than usual in 2021/22 at 27%. Typically this figure has been somewhere between 11% and 16%. This increase is mainly due to reliefs for a small number of very high value residential transactions.
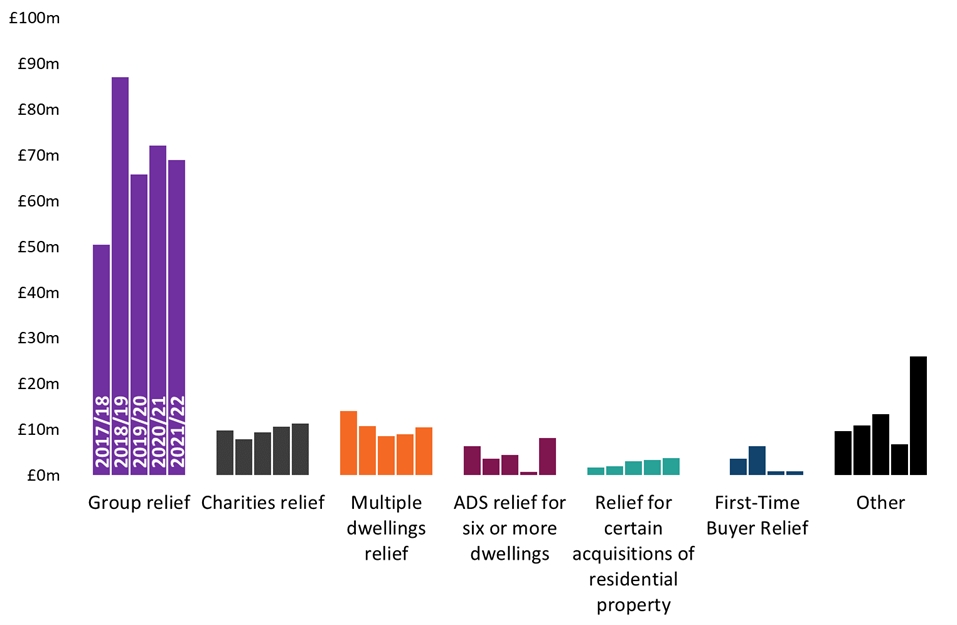
Group relief typically makes up the majority of LBTT forgone to reliefs, accounting for 53% in 2021/22. Changes in the total reliefs are largely driven by changes in group relief. Group relief provides relief from LBTT where the seller and buyer are both companies in the same group. Where certain rules are met, this allows companies to move property within a corporate group structure without a liability for LBTT being incurred.
The second highest proportion of LBTT forgone to relief came from Other reliefs, which groups together all reliefs outside the six biggest single contributors. More information about these reliefs can be found on the Revenue Scotland website. As with residential reliefs, a small number of high value transactions can have a significant impact on the total in this category. Charities relief was next highest, accounting for 9% of revenue forgone to relief.
First-Time Buyer Relief
First-Time Buyer Relief accounted for 91% of returns received in which some LBTT revenue was forgone to relief in 2021/22. Every year since its introduction, aside from in 2020/21, when there was a temporary increase to the nil-rate tax band, First-Time Buyer Relief has made up the majority of claims for relief.
Despite accounting for the vast majority of claims for relief, Figure 19 shows that First-Time Buyer relief accounts for only a small portion of the estimated LBTT revenue foregone to reliefs. This is because First-Time Buyer relief provides a maximum of £600 relief from LBTT per transaction, unlike other relief types which can relieve the entire tax liability of potentially much larger transactions.