Annex A: Employee diversity data
The following charts show the composition of the Revenue Scotland staff body, broken down according to their protected characteristics. Data on Revenue Scotland staff is given for each of the previous three years.
The composition of Revenue Scotland staff is compared to data on Scotland's working age population. Comparator data on age and gender is taken from the National Records of Scotland’s 2024 mid-year population estimates for all people aged 16-65.
Note that a significant proportion of the 16-29 age group in this age distribution are likely to be full time students not in the labour market (According to Scotland’s Census 2022, 4% of Scotland’s population were full-time students aged 16 and over, a proportion largely made up of young adults and typically classified as economically inactive).
Data on disability status, ethnic group, marital status, religion or belief and sexual orientation are taken from the Scottish Survey Core Questions 2023 for people aged 16 64. Data suppression has been applied where counts are less than five to prevent possible disclosure of information about individuals.
This includes the use of a [c] where applicable or grouping of categories. Where the only small counts in a table refer to the ‘prefer not to say’ (PNTS) category, no data suppression is done. Secondary data suppression has also been applied to prevent the calculation of suppressed values by differencing.
Figure 1: Age group breakdown within Revenue Scotland
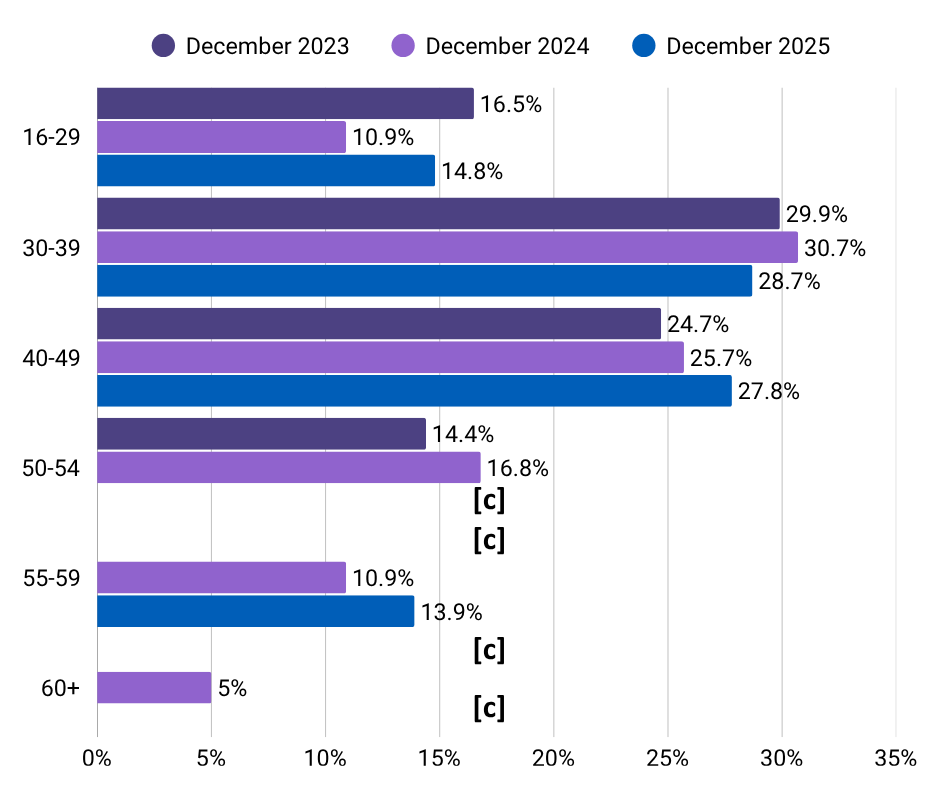
The image is a horizontal bar chart comparing age‑group percentages across three different time points: December 2023, December 2024, and December 2025. Each year is represented by a different colour:
- Dark purple for December 2023
- Light purple for December 2024
- Blue for December 2025
The chart uses horizontal bars grouped by age band. The horizontal axis runs from 0% to 35%, increasing in 5% increments.
Visual Structure
Each age group has up to three bars aligned horizontally next to one another. Data values are printed directly to the right of each bar unless replaced with a “c”. The “c” symbol appears for several age groups where data has been suppressed.
Age Group Data Presented on the Chart
Age 16–29
- December 2023 (dark purple): 16.5%
- December 2024 (light purple): 10.9%
- December 2025 (blue): 14.8%
Age 30–39
- December 2023: 29.9%
- December 2024: 30.7%
- December 2025: 28.7%
Age 40–49
- December 2023: 24.7%
- December 2024: 25.7%
- December 2025: 27.8%
Age 50–54
- December 2023: 14.4%
- December 2024: 16.8%
- December 2025: Marked with “c”
Age 55–59
- December 2023: Marked with “c”
- December 2024: 10.9%
- December 2025: 13.9%
Age 60+
- December 2023: Marked with “c”
- December 2024: 5%
- December 2025: Marked with “c”
Figure 1 shows that we continue to attract a broad mix of generational groups with most staff under 50 years of age.
Figure 2: Sex breakdown within Revenue Scotland
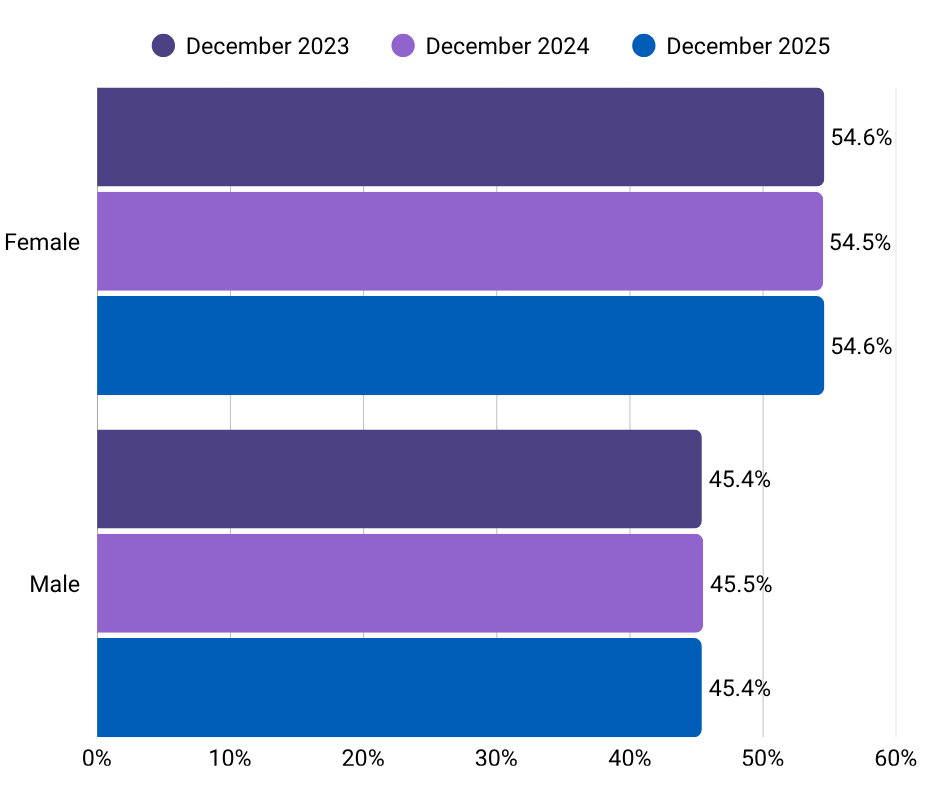
The image is a horizontal bar chart that shows gender representation across three time points: December 2023, December 2024, and December 2025.
A legend at the top identifies three colours:
- Dark purple for December 2023
- Light purple for December 2024
- Blue for December 2025
The horizontal axis runs from 0% to 60%, increasing in 10% increments. The data is grouped by gender, with separate groups for Female and Male. Each group contains three horizontal bars representing the three years.
Visual structure
- The chart has two main horizontal groupings, one for each gender.
- Each grouping contains three bars of similar length, indicating little year‑to‑year variation.
- Percentages are displayed to the right of each bar.
- Female bars appear above Male bars.
Data Presented in the Chart
Female
- December 2023 (dark purple): 54.6%
- December 2024 (light purple): 54.5%
- December 2025 (blue): 54.6%
The bars are nearly identical in length, indicating consistent representation across the three years.
Male
- December 2023: 45.4%
- December 2024: 45.5%
- December 2025: 45.4%
Similarly, the male values stay almost unchanged across the years.
Figure 2 shows no significant change to the previous splits.
Figure 3: Disability status breakdown within Revenue Scotland
![Horizontal bar chart showing declaration rates and disability status for December 2023, December 2024, and December 2025. Declaration rates are 57.7% in 2023, 41.6% in 2024, and 70.4% in 2025. For disabled respondents, values are 21.4% in 2023, [c] in 2024, and 13.2% in 2025. For not disabled respondents, values are 78.6% in 2023, 85.7% in 2024, and 81.6% in 2025. For “Prefer not to say,” values are 0.0% in 2023, [c] in 2024, and 5.3% in 2025.](/sites/default/files/2026-03/Graphs%203.png)
The image is a horizontal bar chart comparing four categories - Declaration rate, Disabled, Not disabled, and Prefer not to say - across three periods: December 2023, December 2024, and December 2025.
A colour legend appears at the top:
- Dark purple for December 2023
- Light purple for December 2024
- Blue for December 2025
The horizontal axis ranges from 0% to 100%, increasing in 20% increments. Each category is displayed with up to three horizontal bars, one for each year.
Visual structure
- Each row represents one of the four categories, with bars arranged horizontally from left to right.
- Values are shown at the end of each bar.
- Suppressed data points appear as “[c]”.
- Declaration rate is displayed first, followed by Disabled, Not disabled, and Prefer not to say.
Data Shown in the Chart
Declaration rate
- December 2023: 57.7%
- December 2024: 41.6%
- December 2025: 70.4%
Disabled
- December 2023: 21.4%
- December 2024: [c]
- December 2025: 13.2%
Not disabled
- December 2023: 78.6%
- December 2024: 85.7%
- December 2025: 81.6%
Prefer not to say
- December 2023: 0.0%
- December 2024: [c]
- December 2025: 5.3%
Figure 3 shows more staff are now sharing diversity information with us, which helps us understand our workforce better.
Figure 4: Ethnic group breakdown within Revenue Scotland
Figure 4 shows little change year on year.
Figure 5: Marital status breakdown within Revenue Scotland
Figure 5 shows more staff are now sharing diversity information with us, which helps us understand our workforce better.
Figure 6: Religion breakdown within Revenue Scotland
Figure 6 shows more staff are now sharing diversity information with us, which helps us understand our workforce better.
Figure 7: Sexual orientation breakdown within Revenue Scotland
Figure 7 shows a broadly unchanged picture year to year.
Figure 8: Socio-economic background breakdown within Revenue Scotland
Figure 8 shows more staff are now sharing diversity information with us, which helps us understand our workforce better.
Figure 9: Caring responsibility breakdown within Revenue Scotland
Figure 9 shows a broadly unchanged picture year to year.
Figure 10: Employee passport breakdown within Revenue Scotland
Figure 10 shows an increasing use of this tool to support staff wellbeing.