

Land and Buildings Transaction Tax (LBTT) monthly statistics: July 2026
Key points
- Residential LBTT, excluding Additional Dwelling Supplement (ADS), was £52.9m in July 2026. This was 12% higher than in June 2026 (£47.1m) and 1% higher than in July 2025 (£52.2m).
- Non-residential LBTT, excluding ADS, was £15.3m in July 2026. This was 5% higher than June 2026 (£14.6m) and 50% lower than July 2025 (£30.7m). Non-residential revenues are highly variable between months because of small numbers of high value transactions.
- Gross Additional Dwelling Supplement for July 2026 was £26.6m, 9% higher than June 2026 (£24.3m) and 9% lower than in July 2025 (£29.1m).
Introduction
This publication is part of a monthly series of Land and Building Transaction Tax (LBTT) statistics, started in April 2015, which provides data on the number and value of notifiable transactions reported to Revenue Scotland.
An Official Statistics Publication for Scotland
These statistics are official statistics. Official statistics are statistics that are produced by crown bodies, those acting on behalf of crown bodies, or those specified in statutory orders, as defined in the Statistics and Registration Service Act 2007.
Revenue Scotland statistics are regulated by the Office for Statistics Regulation (OSR). OSR sets the standards of trustworthiness, quality and value in the Code of Practice for Statistics that all producers of official statistics should adhere to.
Residential LBTT
Residential LBTT, excluding Additional Dwelling Supplement (ADS), was £52.9 million in July 2026.
Figure 1: Line chart displaying residential LBTT, excluding ADS, by month, April 2015 – July 2026.
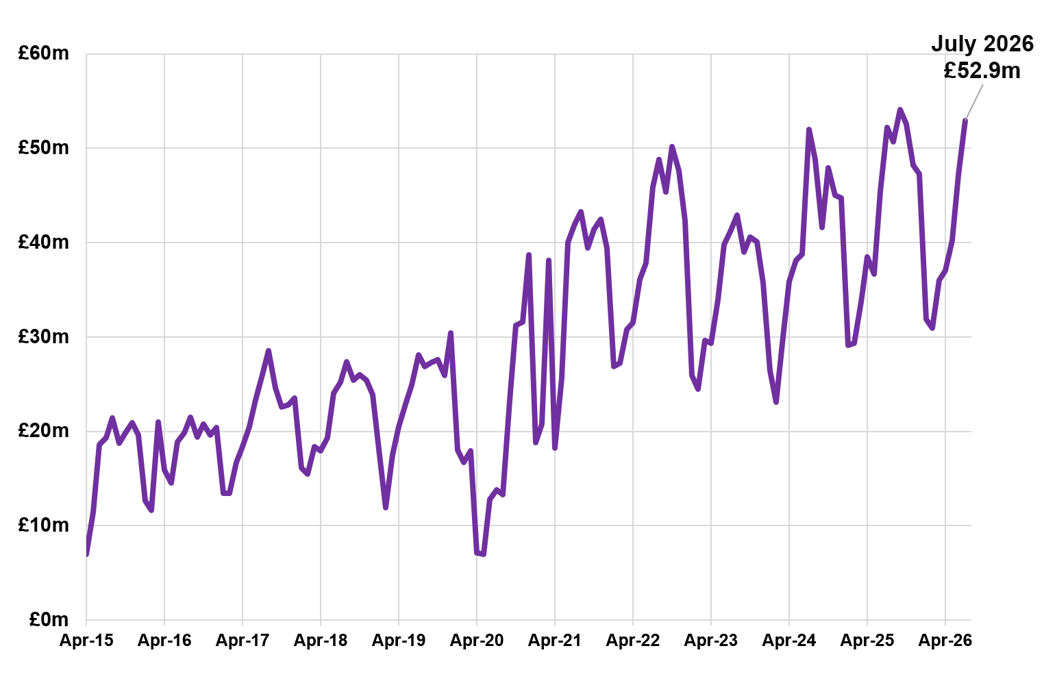
Residential LBTT, excluding ADS, in July 2026 (£52.9m) was 12% higher than in June 2026 (£47.1m). Every year since 2015, residential LBTT has been higher in July than the previous month.
Residential LBTT, excluding ADS, in July 2026 was the highest July figure on record, being 1% higher than the second highest figure in July 2025 (£52.2m).
The number of Residential LBTT returns in July 2026 was 9,730.
Figure 2: Column chart showing residential LBTT returns submitted for each month of July, 2015-2026.
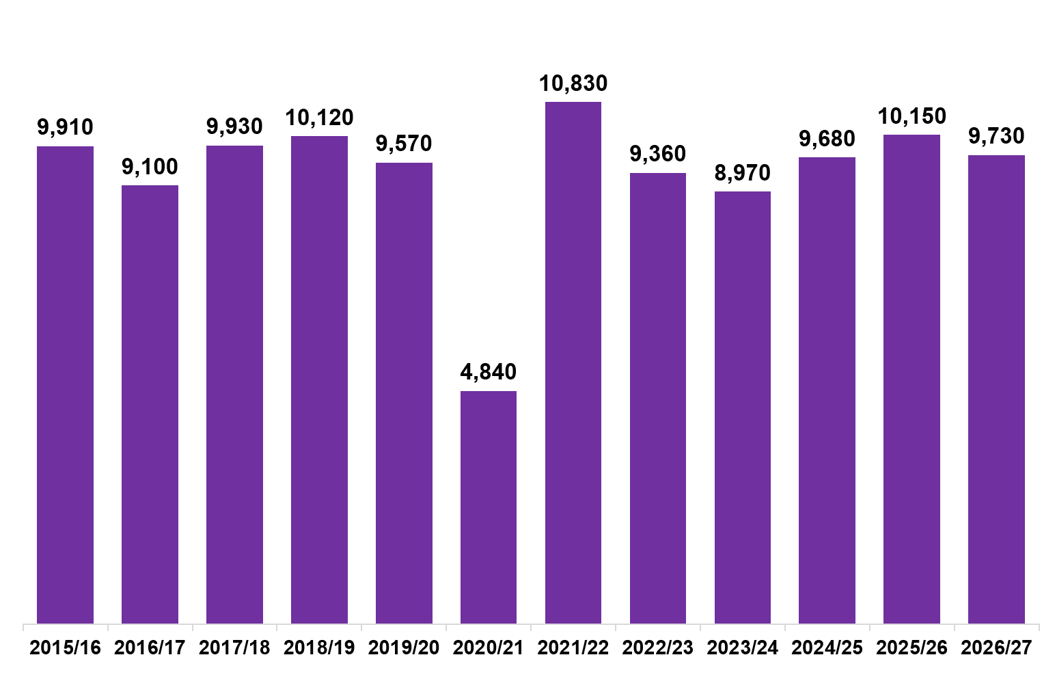
There were 9,730 residential LBTT returns submitted in July 2026, 4% lower than were submitted in July 2025 (10,150).
July had the highest number of returns in the £145,001 to £250,000 LBTT band (3,180 returns), followed by the £325,001 to £750,000 band (1,990 returns), the £250,001 to £325,000 band (1,560 returns) and the £750,000+ band (130 returns). July also had 2,840 returns in the Up to £145,000 band, where no tax was due.
July 2026 and June 2026 had the joint highest number of returns in the £325,001 to £750,000 band (1,990 returns) compared to all previous months.
Non-Residential LBTT, excluding ADS
Non-residential LBTT, excluding ADS, was £15.3 million in July 2026.
Figure 3: Line chart displaying non-residential LBTT, excluding ADS, by month, April 2015 – July 2026.
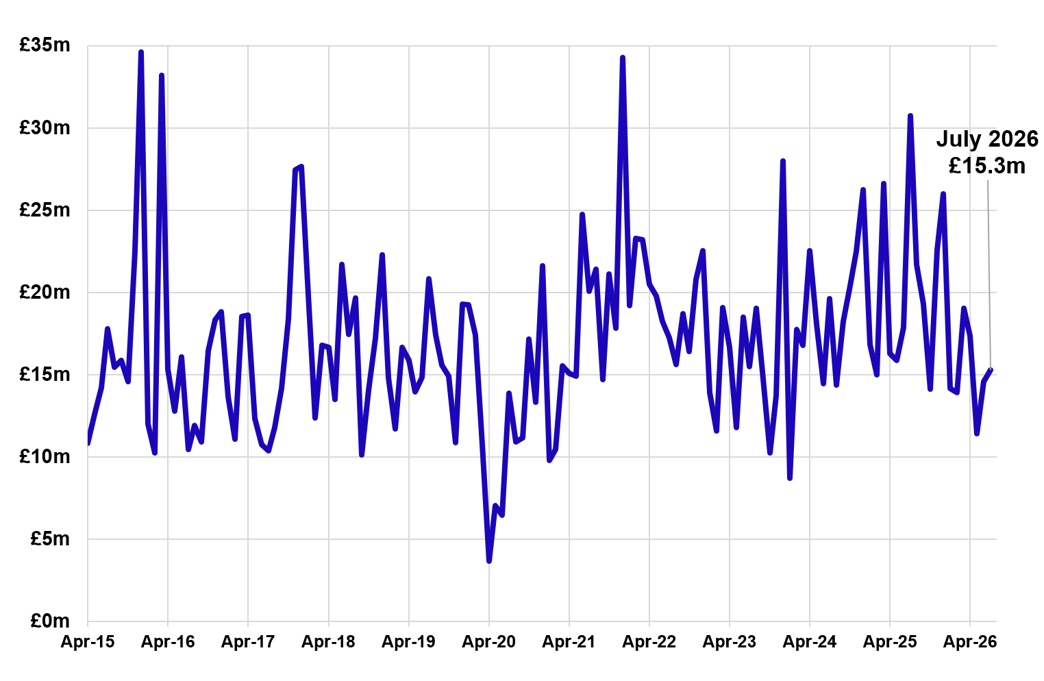
Non-residential LBTT, excluding ADS, was 5% higher in July 2026 (£15.3m) than in June 2026 (£14.6m) and 50% lower than in July 2025 (£30.7m).
Non-residential revenues are highly variable between months because of small numbers of high value transactions.
The number of non-residential conveyance returns submitted in July 2026 was 590. The number of Lease Reviews submitted was 820. The number of new Leases submitted was 410.
Figure 4: Line chart displaying the number of non-residential LBTT returns submitted, by type of return, by month, July 2025 – July 2026.
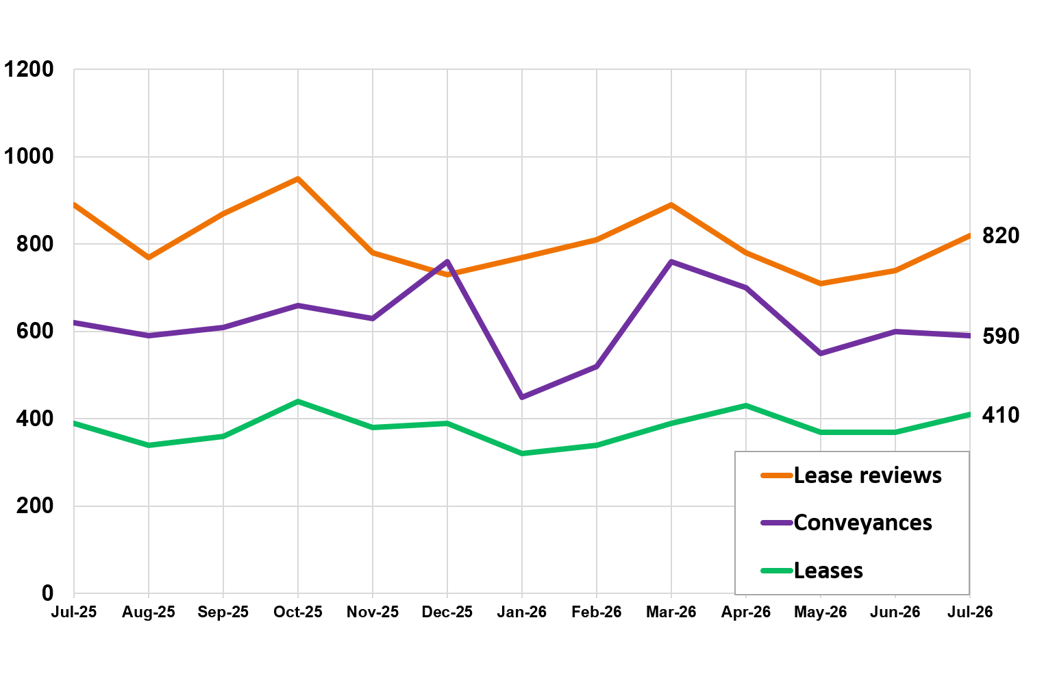
Non-residential conveyance returns decreased by 2% in July 2026 (590 returns) compared to June 2026 (600 returns).
The number of new lease returns increased by 11% in July 2026 (410 returns) compared to June 2026 (370 returns).
Lease review returns increased by 11% in July 2026 (820 returns) compared to June 2026 (740 returns). Lease review returns include 3-year, 6-year and 9-year lease reviews, as well as assignation and termination returns.
Additional Dwelling Supplement (ADS)
The number of LBTT returns received which declared ADS due was 1,740 in July 2026.
Figure 5: Column chart displaying the number of LBTT returns received which declared ADS due, for each month of July, 2016-2026.
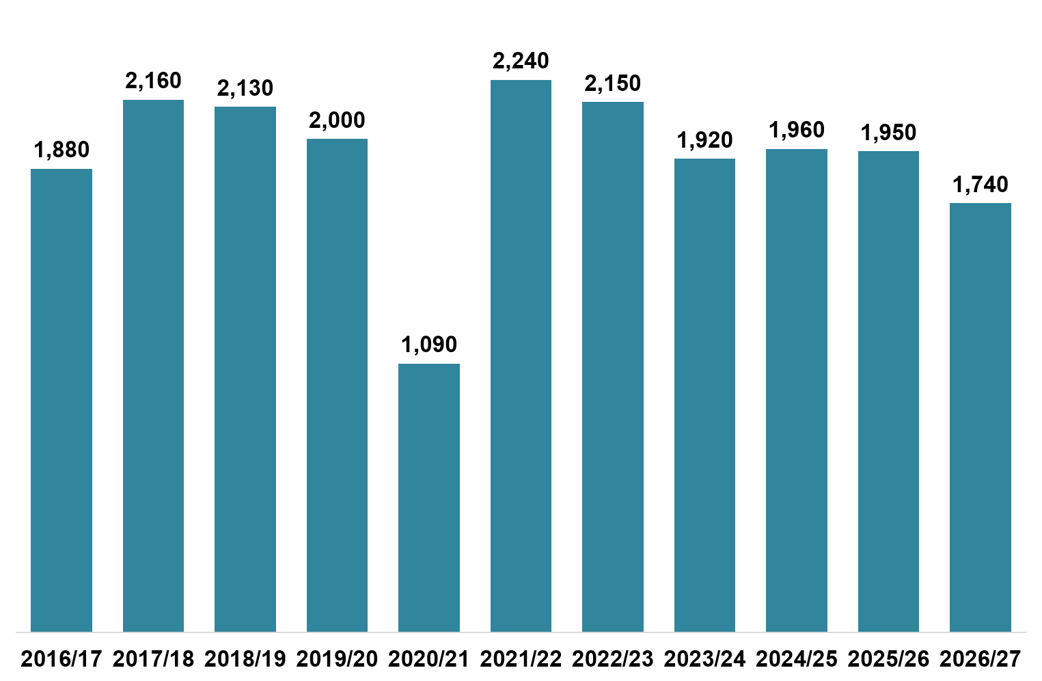
The number of returns with ADS due was 1,740 in July 2026. This is 2% lower than in June 2026 (1,780 returns) and 11% lower than in July of the previous year (1,950 returns).
July 2021 had the highest number of July returns with ADS due, with 2,240.
Gross ADS declared in July 2026 was £26.6 million.
Figure 6: Column chart displaying gross ADS declared due in each month of July, 2016-2026.
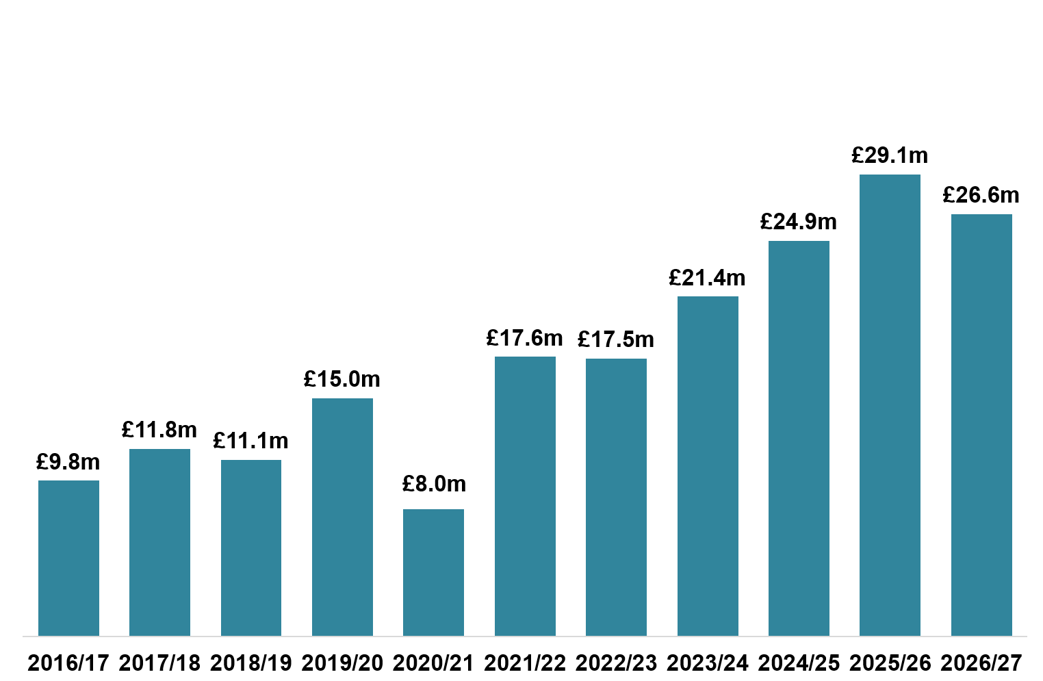
Gross ADS in July 2026 (£26.6m) was 9% higher than in June 2026 (£24.3m) and 9% lower than in July 2025 (£29.1m)
Gross ADS in July 2026 was the second highest of all previous months of July after July 2025.
Tell us what you think
We are always interested to hear from our users about how our statistics are used, and how they can be improved.
Enquiries
For enquiries about this publication please contact:
statistics@revenue.scot